

Set baseline periods, utility rates, and building context for decarbonization planning in EnerG
Model energy conservation and projected savings for one building with capital planning. In the building view, click Capital Planning in the left sidebar. Start on Basic Information to set project parameters before you create measures or . For the underlying concepts, see Measures, curves, and scenarios.For portfolio-wide scenario comparison, see Portfolio capital planning.
Capital Planning menu
After you open Capital Planning, a secondary menu lists the workflow pages.
Page
Purpose
Basic Information
Building context, baseline period, usage charts, and utility rate settings
Measure Creation
Define individual conservation measures
Scenario Planner
Bundle measures into scenarios
Scenario Analysis
Review savings and financial metrics per scenario
Comparison
Compare scenarios side by side
Complete Basic Information before you open Measure Creation, Scenario Planner, Scenario Analysis, or Comparison.
Open Basic Information
1
Select a building
From Portfolio Home, open a building in the building view.
2
Open Capital Planning
Click Capital Planning in the left sidebar, then select Basic Information in the Capital Planning menu.
The page subtitle explains the goal: establish the foundation for effective decarbonization by setting up your project parameters.
Capital Planning Basic Information with building and baseline settings
Building and target settings
The Building & Target Settings card summarizes inputs EnerG pulls from the building record.
Field
What it shows
Building Name
Site label
Primary Heating / Primary Cooling
Dominant HVAC types when configured
Building Area
Gross floor area used in intensity metrics
Service Types
Active commodities, such as Natural Gas, Electric, and Lighting
Click Go to Building Info to update area, systems, or service types on Building information.
Define baseline period
Set the historical window that measures and scenarios use as the reference for savings.
Control
Purpose
Start Date / End Date
Baseline range, such as 05/25/2025 – 05/25/2026
Edit
Change dates after the initial setup
Service Type
Commodity for the summary metrics and chart below
Annual Usage
Total usage for the selected service type in the baseline window
Annual Cost
Total cost for the same period
Pick a period with stable operations and reliable meter coverage. A full calendar year is typical so seasonal patterns appear in charts.
Visualize baseline usage
Scroll below the baseline settings for a multi-series chart and configuration table.
Baseline usage chart with weather overlay and factors table
Control
Purpose
Show Weather Data
Overlay temperature on the chart to explain seasonal drivers
Usage (green bars)
Monthly consumption for the selected service type
Cost (orange line)
Monthly spend aligned to usage
Temperature (blue line)
Outdoor temperature when weather overlay is on
Use the chart to confirm heating or cooling peaks match expectations before you assign savings curves on Measure Creation.
Factors and calculations configuration
The Factors & Calculations Configuration table sets rates and degree-day base temperatures per utility type. See Weather normalization for degree-day settings.
Column
Purpose
Utility Type
Service category, such as Natural Gas, Electric, or Lighting
Utility Rate
Blended cost per unit for simple cost translation
Base Temperature
Reference temperature for heating and cooling degree-day logic, often 65 °F
Actions
Edit icon to update rate or base temperature
Confirm Utility Rate matches the tariff class or blended average you use in audit narratives and Budget planning rate analysis.
Measure Creation
Select Measure Creation in the Capital Planning menu to add conservation measures and manage distribution curves for the building.
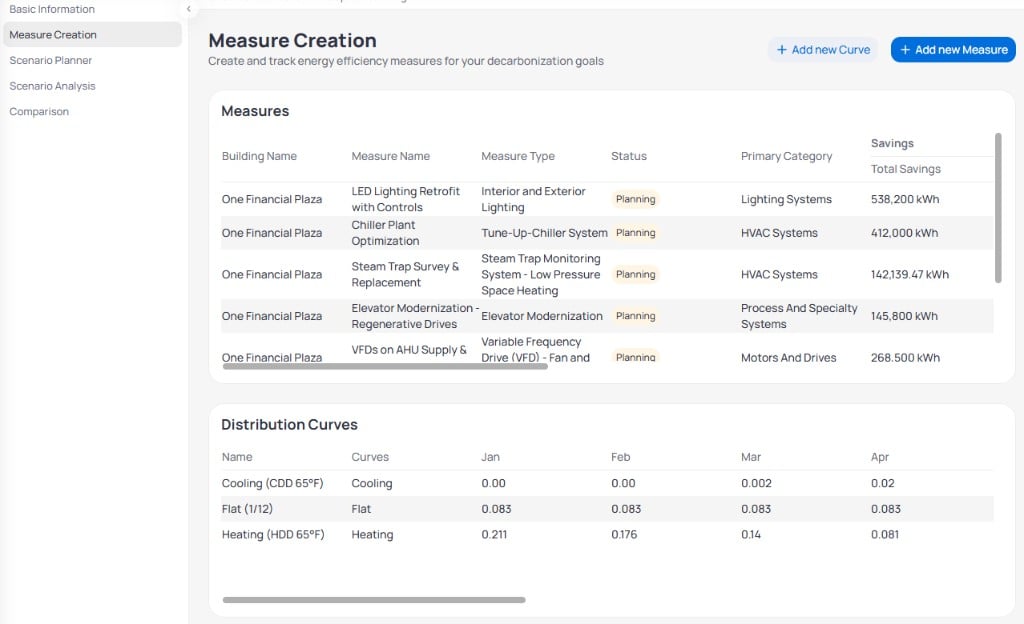
Measure Creation page with Measures table and Distribution Curves
Add a new measure
Click + Add new Measure to open the Add New Measure panel.
Add New Measure panel with category, curve, and savings fields
Field
Purpose
Measure Name
Project label shown in the measures table
Primary Category
Grouping such as Lighting Systems or HVAC Systems
Curve
Distribution curve from the table below, such as Flat or Heating
Status
Planning, Implementation, or Operations
Service Types
Fuels affected by the measure
Capital Cost ($)
Upfront project cost
Incentive Amount ($)
Rebates or grants applied to payback
Incentive Source
Program or funder name for audit trails
Click Save to add the row. EnerG calculates payback and fuel-specific savings columns after you save. Additional fields may appear when you select multiple service types.
Create a custom curve
Click + Add new Curve to open the Create Custom Curve panel when default cooling, heating, or flat curves do not fit your measure.
Create Custom Curve panel with monthly factors
Field
Purpose
Curve Name
Label in the Distribution Curves table
Curve Type
Curve family EnerG uses for allocation logic
January – December
Monthly factor for each month
Monthly values must total 1.000 for annual distribution. The footer shows Total Sum and a validation message until the monthly factors sum to one.
Click Create Curve when the sum reaches 1.000. The new curve appears in the Curve dropdown on Add New Measure.
Measures table
The Measures table lists every conservation project for the building. Scroll horizontally to see financial and fuel-specific columns.
Column
What it shows
Building Name
Site the measure applies to
Measure Name
Project label, such as LED Lighting Retrofit with Controls
Measure Type
Specific technology, such as Interior and Exterior Lighting
Status
Lifecycle state, such as Planning, Implementation, or Operations
Primary Category
Grouping, such as Lighting Systems or HVAC Systems
Total Savings
Annual energy reduction, such as 538,200 kWh
Cost Savings
Annual cost impact, such as $75,348
Electric Saving
Electric commodity savings when applicable
Water Saving
Water savings when applicable
District Steam Saving
Steam savings when applicable
Consumption Savings
Combined consumption impact across fuels
Payback (Years)
Simple payback from capital cost, incentives, and savings
Capital Cost
Upfront project cost, such as $285,000
Incentive Amount
Rebates or grants, such as $64,600
Actions
Edit or delete the measure
Set Operations status only when the operation date is in the past and savings have started.
When a measure reaches Operations, EnerG can connect it to M&V models. Keep the measure record aligned with the meters and models that prove savings.
Distribution curves
The Distribution Curves table defines how annual savings spread across months. EnerG provides default cooling, heating, and flat curves derived from degree-day logic on Basic Information.
Column
What it shows
Name
Curve label, such as Cooling (CDD 65°F), Heating (HDD 65°F), or Flat (1/12)
Curves
Curve family: Cooling, Heating, or Flat
Jan – Dec
Monthly factor that sums to the annual savings profile
Assign a curve when you create or edit a measure so EnerG allocates savings without manual spreadsheet work. For when to use each curve type, see Distribution curves.
Scenario Planner
Select Scenario Planner in the Capital Planning menu to bundle measures into funding packages. Each scenario lists included measures with implementation and operation dates.
Scenario Planner with expandable scenario cards
Click + Add new Scenario to create a bundle. Expand a card to review measures or click Edit Scenario to change dates and membership.
Scenario cards
Each card shows the scenario name, a priority tag, and a table of measures when expanded.
Element
What it shows
Scenario name
Bundle label, such as LED Only or Full retrofit
Priority
High, Medium, or Low planning priority
Measure Name
Measure included in the bundle
Measure Status
Status of each measure, such as Planning
Implementation Date
When work begins
Operation Date
When savings start in reporting
Edit Scenario
Opens the scenario for changes
Implementation date marks construction or install start. Operation date marks when savings first count in forecasts and analysis.
Create a scenario
Click + Add new Scenario to open the Create Scenario panel.
Create Scenario panel with measure selection
Field
Purpose
Scenario Name
Label on the scenario card
Priority
High, Medium, or Low
Select Energy Conservation Measures
Check each measure to include. Tags show the assigned curve, such as Flat (1/12) or Cooling (CDD 65°F)
Click Create Scenario, then open Edit Scenario on the card to set Implementation Date and Operation Date per measure when projects phase over time.Review savings and payback on Scenario Analysis. Compare bundles on Comparison or at the portfolio on Portfolio capital planning.
Scenario Analysis
Select Scenario Analysis in the Capital Planning menu to review financial and environmental impacts for a scenario you built on Scenario Planner.
Scenario Analysis with KPI cards and Target chart
Page controls
Control
Purpose
Consumption / Cost / Emissions
Switch KPI cards and charts between usage, spend, and kgCO₂e
Energy
Filter by energy scope or commodity
Scenario
Select the scenario to analyze, such as LED Only
Measures
Multi-select measures within the scenario
Summary metrics
Five cards roll up results for the active scenario and view.
Card
What it shows
Projected Annual Reduction
Total annual savings, such as 538,200 kWh
Percent Reduction
Savings as a percent of baseline, such as 12.02%
Projected Payback Period
Simple payback in years, such as 2.93
Total Capital Cost
Sum of measure capital costs
Total Incentives
Sum of rebates and grants
Target chart
The Target chart compares long-range trajectories through 2040.
Series
Meaning
TTM Baseline
Trailing-twelve-month baseline without measures
Forecast TTM
Projected use after measures take effect
Target Final
Long-term reduction goal, such as a 2040 Reduction Goal
Target Rolling
Rolling path from baseline toward the final target
Scroll below the Target chart for service-type breakdowns and a measure schedule.
Scenario Analysis Baseline vs Projected chart Reduction table and Measures Timeline
Section
What it shows
Baseline vs. Projected
Grouped bars by service type comparing baseline to projected use
Reduction
Table with Baseline, % of Baseline, Projected, and Reduction per fuel
Measures Timeline
Gantt-style view of when each measure starts savings based on Operation Date
Scenario Analysis shows trailing-twelve-month Forecast TTM and baseline separation for one scenario. Use it when you explain how savings emerge across seasons before you compare bundles on Comparison.
When you stagger implementation dates
Set each measure Implementation Date when work begins and Operation Date when savings start. Staggered dates keep cash flows and contractor access realistic in one scenario.
Scenario Comparison
Select Comparison in the Capital Planning menu to evaluate multiple scenarios side by side on one chart and table.
Scenario Comparison with Capital Planning Roadmap and comparison table
Page controls
Control
Purpose
Energy
Scope or commodity filter for the roadmap
Scenario tags
Select two or more scenarios, such as LED Only and Simple Upgrade
Target goal
Long-range target overlay, such as 2040 Reduction Goal
Consumption / Cost / Emissions
Switch the roadmap and table between usage, spend, and CO₂e
Capital Planning Roadmap
The Capital Planning Roadmap chart projects each selected scenario from the current year through 2040.
Series
Meaning
Baseline
Reference use without new measures
Target
Published reduction path toward the goal year
LED Only TTM / Simple Upgrade TTM / Full retrofit TTM
Trailing-twelve-month forecast per scenario (line color matches the scenario)
Steeper drops indicate larger or earlier savings. Compare scenario lines to Target to see which bundle closes the gap soonest.
Comparison table
The table below the chart summarizes each scenario for the active toggle.
Column
What it shows
Scenario Name
Bundle label
Total Annual Savings (Consumption)
Annual energy reduction
Total Annual Savings (Cost)
Annual cost reduction
Total Annual Savings (CO2e)
Annual emissions reduction
Capex
Total capital cost
Incentives
Total rebates and grants
Projected Annual Consumption
Percent reduction or projected use metric for the scenario
Simple Payback (Years)
Payback period for the bundle
Use the table to compare Simple Payback and Capex when you shortlist funding options. Open Scenario Analysis for a single-scenario drill-down.
Compare at least one low-capex scenario and one deep-retrofit scenario so stakeholders see the tradeoff between payback speed and total savings.
Compare scenarios across buildings on the roadmap chart.
Budget planning
Add capital projects from planning into an annual budget in step 4.
Building information
Update area, heating, cooling, and service types before you lock a baseline.
Last modified on August 19, 2026
Was this page helpful?
{"docsConfig":{"theme":"aspen","$schema":"https://mintlify.com/docs.json","name":"KODE Labs - Product Documentation","colors":{"primary":"#015BFA","light":"#3A9AFF","dark":"#015BFA"},"logo":{"light":"https://mintcdn.com/kodelabs/YfYud6Al4TM68wc2/logo/logo-light.png?fit=max\u0026auto=format\u0026n=YfYud6Al4TM68wc2\u0026q=85\u0026s=00d4ffd6ad7a592e52856804d1a53d12","dark":"https://mintcdn.com/kodelabs/YfYud6Al4TM68wc2/logo/logo-dark.png?fit=max\u0026auto=format\u0026n=YfYud6Al4TM68wc2\u0026q=85\u0026s=a6769f53904d96f5a53ea0c4b3c972d6","href":"/"},"favicon":{"light":"https://mintcdn.com/kodelabs/H3HEEQdnaG21O57-/logo/favicon-light.png?fit=max\u0026auto=format\u0026n=H3HEEQdnaG21O57-\u0026q=85\u0026s=3ae881e353dfb5c2f667e175ec82c799","dark":"https://mintcdn.com/kodelabs/H3HEEQdnaG21O57-/logo/favicon-dark.png?fit=max\u0026auto=format\u0026n=H3HEEQdnaG21O57-\u0026q=85\u0026s=845431bc7d53ce5bf50f56ef53d9137f"},"api":{"params":{"expanded":"closed"},"playground":{"display":"interactive","proxy":true},"examples":{"defaults":"required","languages":["bash","javascript","python","powershell"],"prefill":true,"autogenerate":true},"url":"full"},"appearance":{"default":"light","strict":true},"background":{"color":{"light":"#ffffff","dark":"#121212"}},"navbar":{"links":[{"href":"https://kodelabs.com/contact/","label":"Contact Us"}]},"footer":{"socials":{"x":"https://twitter.com/kodelabs","instagram":"https://www.instagram.com/kode_labs","linkedin":"https://www.linkedin.com/company/kodelabs","youtube":"https://www.youtube.com/channel/UCKCnsgnYtugWxMPzu3UEHkw"},"links":[{"header":"Platform","items":[{"label":"KODE OS","href":"https://kodelabs.com"},{"label":"Integrations","href":"https://kodelabs.com/partners/integrations-library"},{"label":"Security","href":"https://kodelabs.com/security"}]},{"header":"Resources","items":[{"label":"Blog","href":"https://kodelabs.com/blog"},{"label":"Reports \u0026 Guides","href":"https://kodelabs.com/resources"},{"label":"Podcasts \u0026 Webinars","href":"https://kodelabs.com/resources"},{"label":"Case Studies","href":"https://kodelabs.com/case-studies"},{"label":"News","href":"https://kodelabs.com/news"}]},{"header":"Solutions","items":[{"label":"Commercial","href":"https://kodelabs.com/solutions/commercial-real-estate"},{"label":"Corporate","href":"https://kodelabs.com/solutions/corporate"},{"label":"Retail","href":"https://kodelabs.com/solutions/retail"},{"label":"Healthcare","href":"https://kodelabs.com/solutions/healthcare"},{"label":"Education","href":"https://kodelabs.com/solutions/education"}]},{"header":"Company","items":[{"label":"About","href":"https://kodelabs.com/about"},{"label":"Careers","href":"https://kodelabs.com/careers"},{"label":"Internships","href":"https://kodelabs.com/internships"},{"label":"Contact Us","href":"https://kodelabs.com/contact"}]}]},"search":{"prompt":"Search our docs..."},"fonts":{"heading":{"family":"Manrope","weight":600},"body":{"family":"Inter"}},"icons":{"library":"lucide"},"styling":{"eyebrows":"section","codeblocks":{"theme":{"light":"github-light","dark":"github-dark"}},"latex":false},"integrations":{"ga4":{"measurementId":"G-WKYQEE1T4B"}},"banner":{"content":"KODE 3.20 is live. See [what's new in November 2026](/whats-new/2026/v3.20-november-2026).","dismissible":true,"color":{"light":"#015BFA","dark":"#015BFA"}},"errors":{"404":{"redirect":false,"title":"We're working on it!","description":"If you're not seeing this page, we're definitely updating it."}},"contextual":{"options":["copy","view",{"title":"Email KODE support","description":"Contact KODE Labs support for help","icon":"mail","href":"mailto:support@kodelabs.com"}],"display":"toc"},"interaction":{"drilldown":false},"metadata":{"timestamp":true},"navigation":{"global":{"anchors":[{"anchor":"Home","icon":"house","href":"/"},{"anchor":"What's New","icon":"megaphone","href":"/whats-new/2026/v3.20-november-2026"}]},"pages":[]}},"deployment":{"deploymentMetadataValue":{"subdomain":"kodelabs","hasAudioNarration":false,"actualSubdomain":"kodelabs","customDomains":["docs.kodelabs.com"],"gitSource":{"type":"github","owner":"kode-labs","repo":"docs","deployBranch":"main","contentDirectory":"","isPrivate":true,"mountPath":"","label":""},"feedback":{"thumbs":true,"agentFeedback":true},"entitlements":{"AI_CHAT":{"status":"ENABLED"},"REMOVE_BRANDING":{"status":"ENABLED"},"CONTEXTUAL_FEEDBACK":{"status":"ENABLED"},"CODE_SNIPPET_FEEDBACK":{"status":"ENABLED"},"WEB_MCP":{"status":"ENABLED"},"NARRATION":{"status":"ENABLED"}},"buildId":"6af8e4f300819710da52c87a","clientVersion":"0.0.4263","searchFilterCounts":[{"language":"default","tag":"Integrations","count":214},{"language":"default","tag":"All Integrations","count":205},{"language":"default","tag":"KODE API","count":143},{"language":"default","tag":"API reference","count":132},{"language":"default","tag":"EnerG","count":61},{"language":"default","tag":"Meters","count":37},{"language":"default","tag":"Building BI","count":35},{"language":"default","tag":"AssetOps","count":32},{"language":"default","tag":"Cloud BMS","count":31},{"language":"default","tag":"Reference","count":29}],"searchSettings":{"showContentSnippets":true,"isFiltersEnabled":true,"maxResults":10}},"assistantConfig":{"enableStarterQuestions":true,"enableContextualStarterQuestions":true},"basePath":"","hasChatPermissions":true,"hasWebMcpPermissions":true,"toggles":[{"name":"kill-isr","enabled":true,"variant":{"name":"disabled","enabled":false,"feature_enabled":true},"impressionData":false},{"name":"custom-rbac-roles","enabled":true,"variant":{"name":"disabled","enabled":false,"feature_enabled":true},"impressionData":false},{"name":"agent-mintlify-slack","enabled":true,"variant":{"name":"disabled","enabled":false,"feature_enabled":true},"impressionData":false},{"name":"agent-integrations-settings","enabled":true,"variant":{"name":"disabled","enabled":false,"feature_enabled":true},"impressionData":false},{"name":"rbac-expansion","enabled":true,"variant":{"name":"disabled","enabled":false,"feature_enabled":true},"impressionData":false},{"name":"automations-pr-grouping","enabled":true,"variant":{"name":"disabled","enabled":false,"feature_enabled":true},"impressionData":false},{"name":"custom-prefix","enabled":true,"variant":{"name":"disabled","enabled":false,"feature_enabled":true},"impressionData":false},{"name":"analytics-v7","enabled":true,"variant":{"name":"disabled","enabled":false,"feature_enabled":true},"impressionData":false},{"name":"user-flows-analytics","enabled":true,"variant":{"name":"disabled","enabled":false,"feature_enabled":true},"impressionData":false},{"name":"no-publish-flow","enabled":true,"variant":{"name":"disabled","enabled":false,"feature_enabled":true},"impressionData":false},{"name":"workos-onboarding","enabled":true,"variant":{"name":"disabled","enabled":false,"feature_enabled":true},"impressionData":false},{"name":"snapshot-serving-live","enabled":true,"variant":{"name":"disabled","enabled":false,"feature_enabled":true},"impressionData":false},{"name":"stripTemperatureMiddleware","enabled":true,"variant":{"name":"disabled","enabled":false,"feature_enabled":true},"impressionData":false},{"name":"support-platform-pylon-zendesk","enabled":true,"variant":{"name":"disabled","enabled":false,"feature_enabled":true},"impressionData":false},{"name":"snapshot-serving","enabled":true,"variant":{"name":"disabled","enabled":false,"feature_enabled":true},"impressionData":false},{"name":"instant-rollback","enabled":true,"variant":{"name":"disabled","enabled":false,"feature_enabled":true},"impressionData":false},{"name":"granular-notifications-server","enabled":true,"variant":{"name":"disabled","enabled":false,"feature_enabled":true},"impressionData":false},{"name":"granular-notifications","enabled":true,"variant":{"name":"disabled","enabled":false,"feature_enabled":true},"impressionData":false},{"name":"automations-fable","enabled":true,"variant":{"name":"disabled","enabled":false,"feature_enabled":true},"impressionData":false},{"name":"fixed-ai-action-pricing","enabled":true,"variant":{"name":"disabled","enabled":false,"feature_enabled":true},"impressionData":false},{"name":"site-roles","enabled":true,"variant":{"name":"disabled","enabled":false,"feature_enabled":true},"impressionData":false},{"name":"automation-resolve-merge-conflict","enabled":true,"variant":{"name":"disabled","enabled":false,"feature_enabled":true},"impressionData":false},{"name":"scoped-publishing","enabled":true,"variant":{"name":"disabled","enabled":false,"feature_enabled":true},"impressionData":false},{"name":"mintql","enabled":true,"variant":{"name":"disabled","enabled":false,"feature_enabled":true},"impressionData":false},{"name":"page-level-analytics","enabled":true,"variant":{"name":"disabled","enabled":false,"feature_enabled":true},"impressionData":false},{"name":"editor-version-history-v2","enabled":true,"variant":{"name":"disabled","enabled":false,"feature_enabled":true},"impressionData":false},{"name":"billing-page-v2","enabled":true,"variant":{"name":"disabled","enabled":false,"feature_enabled":true},"impressionData":false},{"name":"full-page-search","enabled":true,"variant":{"name":"disabled","enabled":false,"feature_enabled":true},"impressionData":false},{"name":"workspace-projects","enabled":true,"variant":{"name":"disabled","enabled":false,"feature_enabled":true},"impressionData":false},{"name":"assistant-v5","enabled":true,"variant":{"name":"disabled","enabled":false,"feature_enabled":true},"impressionData":false},{"name":"fork-pr-previews","enabled":true,"variant":{"name":"disabled","enabled":false,"feature_enabled":true},"impressionData":false},{"name":"revalidation-jwt","enabled":true,"variant":{"name":"disabled","enabled":false,"feature_enabled":true},"impressionData":false},{"name":"workos-sso-scim","enabled":true,"variant":{"name":"disabled","enabled":false,"feature_enabled":true},"impressionData":false},{"name":"hobby-abuse-scan","enabled":true,"variant":{"name":"disabled","enabled":false,"feature_enabled":true},"impressionData":false},{"name":"dashboard-inbox","enabled":true,"variant":{"name":"disabled","enabled":false,"feature_enabled":true},"impressionData":false},{"name":"workos-signup","enabled":true,"variant":{"name":"disabled","enabled":false,"feature_enabled":true},"impressionData":false},{"name":"turbopuffer-dual-write","enabled":true,"variant":{"name":"disabled","enabled":false,"feature_enabled":true},"impressionData":false},{"name":"workos-enabled","enabled":true,"variant":{"name":"disabled","enabled":false,"feature_enabled":true},"impressionData":false},{"name":"approve-review-flow","enabled":true,"variant":{"name":"disabled","enabled":false,"feature_enabled":true},"impressionData":false},{"name":"editor-metadata","enabled":true,"variant":{"name":"disabled","enabled":false,"feature_enabled":true},"impressionData":false},{"name":"sso-setup-deadline-banner","enabled":true,"variant":{"name":"disabled","enabled":false,"feature_enabled":true},"impressionData":false},{"name":"turbopuffer-serve","enabled":true,"variant":{"name":"disabled","enabled":false,"feature_enabled":true},"impressionData":false},{"name":"live-agents","enabled":true,"variant":{"name":"disabled","enabled":false,"feature_enabled":true},"impressionData":false},{"name":"starter-pricing","enabled":true,"variant":{"name":"treatment","enabled":true,"payload":{"type":"string","value":"treatment"},"feature_enabled":true},"impressionData":false},{"name":"llms-txt-v2","enabled":true,"variant":{"name":"disabled","enabled":false,"feature_enabled":true},"impressionData":false},{"name":"wildcard-email-auth","enabled":true,"variant":{"name":"disabled","enabled":false,"feature_enabled":true},"impressionData":false}],"googleFontsInlined":true},"customCss":[{"filePath":"custom.css","href":"/_mintlify/custom/kodelabs/fd6257d3326e3afa/custom.css"}]}
{"page":{"pagePath":"products/energ/sustainability/capital-planning","slug":"/products/energ/sustainability/capital-planning","pageMetadata":{"title":"Capital planning","sidebarTitle":"Capital planning","description":"Set baseline periods, utility rates, and building context for decarbonization planning in EnerG","icon":"landmark","keywords":["EnerG","capital planning","basic information","baseline period","utility rates","decarbonization","KODE OS"],"href":"/products/energ/sustainability/capital-planning"},"description":{"compiledSource":"\"use strict\";\nconst {jsx: _jsx} = arguments[0];\nconst {useMDXComponents: _provideComponents} = arguments[0];\nfunction _createMdxContent(props) {\n const _components = {\n p: \"p\",\n ..._provideComponents(),\n ...props.components\n };\n return _jsx(_components.p, {\n children: \"Set baseline periods, utility rates, and building context for decarbonization planning in EnerG\"\n });\n}\nfunction MDXContent(props = {}) {\n const {wrapper: MDXLayout} = {\n ..._provideComponents(),\n ...props.components\n };\n return MDXLayout ? _jsx(MDXLayout, {\n ...props,\n children: _jsx(_createMdxContent, {\n ...props\n })\n }) : _createMdxContent(props);\n}\nreturn {\n default: MDXContent\n};\n","frontmatter":{},"scope":{}},"pageType":"default","mdx":{"mdxSource":{"compiledSource":"\"use strict\";const{Fragment:_Fragment,jsx:_jsx,jsxs:_jsxs}=arguments[0];const{useMDXComponents:_provideComponents}=arguments[0];function _createMdxContent(props){const _components={a:`a`,p:`p`,strong:`strong`,tbody:`tbody`,td:`td`,th:`th`,thead:`thead`,tr:`tr`,..._provideComponents(),...props.components},{Accordion,Card,CardGroup,Check,Frame,Heading,Note,OptimizedImage,Step,Steps,Table,Tip,Tooltip,Warning}=_components;if(!Accordion)_missingMdxReference(`Accordion`,true);if(!Card)_missingMdxReference(`Card`,true);if(!CardGroup)_missingMdxReference(`CardGroup`,true);if(!Check)_missingMdxReference(`Check`,true);if(!Frame)_missingMdxReference(`Frame`,true);if(!Heading)_missingMdxReference(`Heading`,true);if(!Note)_missingMdxReference(`Note`,true);if(!OptimizedImage)_missingMdxReference(`OptimizedImage`,true);if(!Step)_missingMdxReference(`Step`,true);if(!Steps)_missingMdxReference(`Steps`,true);if(!Table)_missingMdxReference(`Table`,true);if(!Tip)_missingMdxReference(`Tip`,true);if(!Tooltip)_missingMdxReference(`Tooltip`,true);if(!Warning)_missingMdxReference(`Warning`,true);return _jsxs(_Fragment,{children:[_jsxs(_components.p,{children:[`Model energy conservation `,_jsx(Tooltip,{tip:`A conservation measure is one project with savings, capital cost, and incentives.`,children:`measures`}),` and projected savings for one building with capital planning. In the `,_jsx(_components.a,{href:`/products/energ/get-started/navigation#building-view`,children:`building view`}),`, click `,_jsx(_components.strong,{children:`Capital Planning`}),` in the left sidebar. Start on `,_jsx(_components.strong,{children:`Basic Information`}),` to set project parameters before you create measures or `,_jsx(Tooltip,{tip:`A scenario bundles measures into a funding package with priority and dates.`,children:`scenarios`}),`. For the underlying concepts, see `,_jsx(_components.a,{href:`/products/energ/concepts/budgets-and-capital-planning#measures-curves-and-scenarios`,children:`Measures, curves, and scenarios`}),`.`]}),`\n`,_jsxs(_components.p,{children:[`For portfolio-wide scenario comparison, see `,_jsx(_components.a,{href:`/products/energ/analytics/portfolio-capital-planning`,children:`Portfolio capital planning`}),`.`]}),`\n`,_jsx(Heading,{level:`2`,id:`capital-planning-menu`,children:`Capital Planning menu`}),`\n`,_jsxs(_components.p,{children:[`After you open `,_jsx(_components.strong,{children:`Capital Planning`}),`, a secondary menu lists the workflow pages.`]}),`\n`,_jsxs(Table,{children:[_jsx(_components.thead,{children:_jsxs(_components.tr,{children:[_jsx(_components.th,{children:`Page`}),_jsx(_components.th,{children:`Purpose`})]})}),_jsxs(_components.tbody,{children:[_jsxs(_components.tr,{children:[_jsx(_components.td,{children:_jsx(_components.strong,{children:`Basic Information`})}),_jsx(_components.td,{children:`Building context, baseline period, usage charts, and utility rate settings`})]}),_jsxs(_components.tr,{children:[_jsx(_components.td,{children:_jsx(_components.strong,{children:`Measure Creation`})}),_jsx(_components.td,{children:`Define individual conservation measures`})]}),_jsxs(_components.tr,{children:[_jsx(_components.td,{children:_jsx(_components.strong,{children:`Scenario Planner`})}),_jsx(_components.td,{children:`Bundle measures into scenarios`})]}),_jsxs(_components.tr,{children:[_jsx(_components.td,{children:_jsx(_components.strong,{children:`Scenario Analysis`})}),_jsx(_components.td,{children:`Review savings and financial metrics per scenario`})]}),_jsxs(_components.tr,{children:[_jsx(_components.td,{children:_jsx(_components.strong,{children:`Comparison`})}),_jsx(_components.td,{children:`Compare scenarios side by side`})]})]})]}),`\n`,_jsxs(_components.p,{children:[`Complete `,_jsx(_components.a,{href:`#open-basic-information`,children:`Basic Information`}),` before you open `,_jsx(_components.strong,{children:`Measure Creation`}),`, `,_jsx(_components.strong,{children:`Scenario Planner`}),`, `,_jsx(_components.strong,{children:`Scenario Analysis`}),`, or `,_jsx(_components.strong,{children:`Comparison`}),`.`]}),`\n`,_jsx(Heading,{level:`2`,id:`open-basic-information`,children:`Open Basic Information`}),`\n`,_jsxs(Steps,{children:[_jsx(Step,{title:`Select a building`,children:_jsxs(_components.p,{children:[`From `,_jsx(_components.a,{href:`/products/energ/analytics/benchmarking`,children:`Portfolio Home`}),`, open a building in the building view.`]})}),_jsx(Step,{title:`Open Capital Planning`,children:_jsxs(_components.p,{children:[`Click `,_jsx(_components.strong,{children:`Capital Planning`}),` in the left sidebar, then select `,_jsx(_components.strong,{children:`Basic Information`}),` in the Capital Planning menu.`]})})]}),`\n`,_jsx(_components.p,{children:`The page subtitle explains the goal: establish the foundation for effective decarbonization by setting up your project parameters.`}),`\n`,_jsx(Frame,{caption:`Capital Planning Basic Information with building and baseline settings`,children:_jsx(OptimizedImage,{src:`https://mintcdn.com/kodelabs/0XJAojMwxBOWwfw5/images/energ/energ-capital-planning-basic-information.png?fit=max\u0026auto=format\u0026n=0XJAojMwxBOWwfw5\u0026q=85\u0026s=73d7ab0fc2d233b63fd4626818148bf0`,alt:`Capital Planning Basic Information for KODE 1420 Office showing Building and Target Settings with building area 100000 square feet service types Natural Gas Electric Lighting Go to Building Info link Define Baseline Period dates 05/25/2025 to 05/25/2026 Service Type Natural Gas and Annual Usage 22516.29 kWh Annual Cost 843.62`,\"data-og-width\":`1024`,width:`1024`,\"data-og-height\":`419`,height:`419`,\"data-path\":`images/energ/energ-capital-planning-basic-information.png`,\"data-optimize\":`true`,\"data-opv\":`3`,srcset:`https://mintcdn.com/kodelabs/0XJAojMwxBOWwfw5/images/energ/energ-capital-planning-basic-information.png?w=280\u0026fit=max\u0026auto=format\u0026n=0XJAojMwxBOWwfw5\u0026q=85\u0026s=c42fd8a5a999b729897b436f0287775a 280w, https://mintcdn.com/kodelabs/0XJAojMwxBOWwfw5/images/energ/energ-capital-planning-basic-information.png?w=560\u0026fit=max\u0026auto=format\u0026n=0XJAojMwxBOWwfw5\u0026q=85\u0026s=c2bd5f5526f87d8b3c0c3b0a56836a7f 560w, https://mintcdn.com/kodelabs/0XJAojMwxBOWwfw5/images/energ/energ-capital-planning-basic-information.png?w=840\u0026fit=max\u0026auto=format\u0026n=0XJAojMwxBOWwfw5\u0026q=85\u0026s=80d7c9c21ef6b3371eebd2dbac3006ee 840w, https://mintcdn.com/kodelabs/0XJAojMwxBOWwfw5/images/energ/energ-capital-planning-basic-information.png?w=1100\u0026fit=max\u0026auto=format\u0026n=0XJAojMwxBOWwfw5\u0026q=85\u0026s=2c69f462ec394e644ff740c1a2772842 1100w, https://mintcdn.com/kodelabs/0XJAojMwxBOWwfw5/images/energ/energ-capital-planning-basic-information.png?w=1650\u0026fit=max\u0026auto=format\u0026n=0XJAojMwxBOWwfw5\u0026q=85\u0026s=c7ad7b20b2eeb8338a0285f522dc865f 1650w, https://mintcdn.com/kodelabs/0XJAojMwxBOWwfw5/images/energ/energ-capital-planning-basic-information.png?w=2500\u0026fit=max\u0026auto=format\u0026n=0XJAojMwxBOWwfw5\u0026q=85\u0026s=7b2c0b7aa1242efa361f6177033ee338 2500w`})}),`\n`,_jsx(Heading,{level:`2`,id:`building-and-target-settings`,children:`Building and target settings`}),`\n`,_jsxs(_components.p,{children:[`The `,_jsx(_components.strong,{children:`Building \u0026 Target Settings`}),` card summarizes inputs EnerG pulls from the building record.`]}),`\n`,_jsxs(Table,{children:[_jsx(_components.thead,{children:_jsxs(_components.tr,{children:[_jsx(_components.th,{children:`Field`}),_jsx(_components.th,{children:`What it shows`})]})}),_jsxs(_components.tbody,{children:[_jsxs(_components.tr,{children:[_jsx(_components.td,{children:_jsx(_components.strong,{children:`Building Name`})}),_jsx(_components.td,{children:`Site label`})]}),_jsxs(_components.tr,{children:[_jsxs(_components.td,{children:[_jsx(_components.strong,{children:`Primary Heating`}),` / `,_jsx(_components.strong,{children:`Primary Cooling`})]}),_jsx(_components.td,{children:`Dominant HVAC types when configured`})]}),_jsxs(_components.tr,{children:[_jsx(_components.td,{children:_jsx(_components.strong,{children:`Building Area`})}),_jsx(_components.td,{children:`Gross floor area used in intensity metrics`})]}),_jsxs(_components.tr,{children:[_jsx(_components.td,{children:_jsx(_components.strong,{children:`Service Types`})}),_jsxs(_components.td,{children:[`Active commodities, such as `,_jsx(_components.strong,{children:`Natural Gas`}),`, `,_jsx(_components.strong,{children:`Electric`}),`, and `,_jsx(_components.strong,{children:`Lighting`})]})]})]})]}),`\n`,_jsxs(_components.p,{children:[`Click `,_jsx(_components.strong,{children:`Go to Building Info`}),` to update area, systems, or service types on `,_jsx(_components.a,{href:`/products/energ/buildings/building-information`,children:`Building information`}),`.`]}),`\n`,_jsx(Heading,{level:`2`,id:`define-baseline-period`,children:`Define baseline period`}),`\n`,_jsx(_components.p,{children:`Set the historical window that measures and scenarios use as the reference for savings.`}),`\n`,_jsxs(Table,{children:[_jsx(_components.thead,{children:_jsxs(_components.tr,{children:[_jsx(_components.th,{children:`Control`}),_jsx(_components.th,{children:`Purpose`})]})}),_jsxs(_components.tbody,{children:[_jsxs(_components.tr,{children:[_jsxs(_components.td,{children:[_jsx(_components.strong,{children:`Start Date`}),` / `,_jsx(_components.strong,{children:`End Date`})]}),_jsxs(_components.td,{children:[`Baseline range, such as `,_jsx(_components.strong,{children:`05/25/2025 – 05/25/2026`})]})]}),_jsxs(_components.tr,{children:[_jsx(_components.td,{children:_jsx(_components.strong,{children:`Edit`})}),_jsx(_components.td,{children:`Change dates after the initial setup`})]}),_jsxs(_components.tr,{children:[_jsx(_components.td,{children:_jsx(_components.strong,{children:`Service Type`})}),_jsx(_components.td,{children:`Commodity for the summary metrics and chart below`})]}),_jsxs(_components.tr,{children:[_jsx(_components.td,{children:_jsx(_components.strong,{children:`Annual Usage`})}),_jsx(_components.td,{children:`Total usage for the selected service type in the baseline window`})]}),_jsxs(_components.tr,{children:[_jsx(_components.td,{children:_jsx(_components.strong,{children:`Annual Cost`})}),_jsx(_components.td,{children:`Total cost for the same period`})]})]})]}),`\n`,_jsxs(_components.p,{children:[`Pick a period with stable operations and reliable `,_jsx(_components.a,{href:`/products/energ/buildings/meters`,children:`meter`}),` coverage. A full calendar year is typical so seasonal patterns appear in charts.`]}),`\n`,_jsx(Heading,{level:`2`,id:`visualize-baseline-usage`,children:`Visualize baseline usage`}),`\n`,_jsx(_components.p,{children:`Scroll below the baseline settings for a multi-series chart and configuration table.`}),`\n`,_jsx(Frame,{caption:`Baseline usage chart with weather overlay and factors table`,children:_jsx(OptimizedImage,{src:`https://mintcdn.com/kodelabs/0XJAojMwxBOWwfw5/images/energ/energ-capital-planning-baseline-chart.png?fit=max\u0026auto=format\u0026n=0XJAojMwxBOWwfw5\u0026q=85\u0026s=4c9597120233e65840d6df4aa0a6e984`,alt:`Baseline chart with Show Weather Data toggle on displaying Usage kWh bars Cost orange line and Temperature blue line from May 2025 through March 2026 and Factors and Calculations Configuration table for Natural Gas Electric and Lighting with Utility Rate and Base Temperature 65 degrees F`,\"data-og-width\":`984`,width:`984`,\"data-og-height\":`720`,height:`720`,\"data-path\":`images/energ/energ-capital-planning-baseline-chart.png`,\"data-optimize\":`true`,\"data-opv\":`3`,srcset:`https://mintcdn.com/kodelabs/0XJAojMwxBOWwfw5/images/energ/energ-capital-planning-baseline-chart.png?w=280\u0026fit=max\u0026auto=format\u0026n=0XJAojMwxBOWwfw5\u0026q=85\u0026s=ebdd9ae2d7344f68af7b68072a4f101d 280w, https://mintcdn.com/kodelabs/0XJAojMwxBOWwfw5/images/energ/energ-capital-planning-baseline-chart.png?w=560\u0026fit=max\u0026auto=format\u0026n=0XJAojMwxBOWwfw5\u0026q=85\u0026s=757ccae2e6a5d8387d7fe893436f51e5 560w, https://mintcdn.com/kodelabs/0XJAojMwxBOWwfw5/images/energ/energ-capital-planning-baseline-chart.png?w=840\u0026fit=max\u0026auto=format\u0026n=0XJAojMwxBOWwfw5\u0026q=85\u0026s=2e8185c56684a1979e51a884a0857b35 840w, https://mintcdn.com/kodelabs/0XJAojMwxBOWwfw5/images/energ/energ-capital-planning-baseline-chart.png?w=1100\u0026fit=max\u0026auto=format\u0026n=0XJAojMwxBOWwfw5\u0026q=85\u0026s=0b3939a39c93843abbcb41d1ff855e37 1100w, https://mintcdn.com/kodelabs/0XJAojMwxBOWwfw5/images/energ/energ-capital-planning-baseline-chart.png?w=1650\u0026fit=max\u0026auto=format\u0026n=0XJAojMwxBOWwfw5\u0026q=85\u0026s=87fd9af5c4020ce7e4b9c02239687a29 1650w, https://mintcdn.com/kodelabs/0XJAojMwxBOWwfw5/images/energ/energ-capital-planning-baseline-chart.png?w=2500\u0026fit=max\u0026auto=format\u0026n=0XJAojMwxBOWwfw5\u0026q=85\u0026s=11979afe4fe0cea5e72f5de66971f088 2500w`})}),`\n`,_jsxs(Table,{children:[_jsx(_components.thead,{children:_jsxs(_components.tr,{children:[_jsx(_components.th,{children:`Control`}),_jsx(_components.th,{children:`Purpose`})]})}),_jsxs(_components.tbody,{children:[_jsxs(_components.tr,{children:[_jsx(_components.td,{children:_jsx(_components.strong,{children:`Show Weather Data`})}),_jsx(_components.td,{children:`Overlay temperature on the chart to explain seasonal drivers`})]}),_jsxs(_components.tr,{children:[_jsxs(_components.td,{children:[_jsx(_components.strong,{children:`Usage`}),` (green bars)`]}),_jsx(_components.td,{children:`Monthly consumption for the selected service type`})]}),_jsxs(_components.tr,{children:[_jsxs(_components.td,{children:[_jsx(_components.strong,{children:`Cost`}),` (orange line)`]}),_jsx(_components.td,{children:`Monthly spend aligned to usage`})]}),_jsxs(_components.tr,{children:[_jsxs(_components.td,{children:[_jsx(_components.strong,{children:`Temperature`}),` (blue line)`]}),_jsx(_components.td,{children:`Outdoor temperature when weather overlay is on`})]})]})]}),`\n`,_jsxs(_components.p,{children:[`Use the chart to confirm heating or cooling peaks match expectations before you assign savings curves on `,_jsx(_components.a,{href:`#measure-creation`,children:`Measure Creation`}),`.`]}),`\n`,_jsx(Heading,{level:`2`,id:`factors-and-calculations-configuration`,children:`Factors and calculations configuration`}),`\n`,_jsxs(_components.p,{children:[`The `,_jsx(_components.strong,{children:`Factors \u0026 Calculations Configuration`}),` table sets rates and degree-day base temperatures per utility type. See `,_jsx(_components.a,{href:`/products/energ/reference/calculations-and-parameters#weather-normalization`,children:`Weather normalization`}),` for degree-day settings.`]}),`\n`,_jsxs(Table,{children:[_jsx(_components.thead,{children:_jsxs(_components.tr,{children:[_jsx(_components.th,{children:`Column`}),_jsx(_components.th,{children:`Purpose`})]})}),_jsxs(_components.tbody,{children:[_jsxs(_components.tr,{children:[_jsx(_components.td,{children:_jsx(_components.strong,{children:`Utility Type`})}),_jsxs(_components.td,{children:[`Service category, such as `,_jsx(_components.strong,{children:`Natural Gas`}),`, `,_jsx(_components.strong,{children:`Electric`}),`, or `,_jsx(_components.strong,{children:`Lighting`})]})]}),_jsxs(_components.tr,{children:[_jsx(_components.td,{children:_jsx(_components.strong,{children:`Utility Rate`})}),_jsx(_components.td,{children:`Blended cost per unit for simple cost translation`})]}),_jsxs(_components.tr,{children:[_jsx(_components.td,{children:_jsx(_components.strong,{children:`Base Temperature`})}),_jsxs(_components.td,{children:[`Reference temperature for heating and cooling degree-day logic, often `,_jsx(_components.strong,{children:`65 °F`})]})]}),_jsxs(_components.tr,{children:[_jsx(_components.td,{children:_jsx(_components.strong,{children:`Actions`})}),_jsx(_components.td,{children:`Edit icon to update rate or base temperature`})]})]})]}),`\n`,_jsx(Check,{children:_jsxs(_components.p,{children:[`Confirm `,_jsx(_components.strong,{children:`Utility Rate`}),` matches the tariff class or blended average you use in audit narratives and `,_jsx(_components.a,{href:`/products/energ/finance/budget-planning`,children:`Budget planning`}),` rate analysis.`]})}),`\n`,_jsx(Heading,{level:`2`,id:`measure-creation`,children:`Measure Creation`}),`\n`,_jsxs(_components.p,{children:[`Select `,_jsx(_components.strong,{children:`Measure Creation`}),` in the Capital Planning menu to add conservation measures and manage distribution curves for the building.`]}),`\n`,_jsx(Frame,{caption:`Measure Creation page with Measures table and Distribution Curves`,children:_jsx(OptimizedImage,{src:`https://mintcdn.com/kodelabs/0XJAojMwxBOWwfw5/images/energ/energ-capital-planning-measure-creation.png?fit=max\u0026auto=format\u0026n=0XJAojMwxBOWwfw5\u0026q=85\u0026s=3155f483043f17f917b549d70e2f487b`,alt:`Measure Creation page showing Measures table with LED Lighting Retrofit with Controls Planning status Lighting Systems 538200 kWh savings 75348 cost 2.93 year payback 285000 capital 64600 incentive and Distribution Curves table with Cooling Flat and Heating monthly factors`,\"data-og-width\":`1024`,width:`1024`,\"data-og-height\":`624`,height:`624`,\"data-path\":`images/energ/energ-capital-planning-measure-creation.png`,\"data-optimize\":`true`,\"data-opv\":`3`,srcset:`https://mintcdn.com/kodelabs/0XJAojMwxBOWwfw5/images/energ/energ-capital-planning-measure-creation.png?w=280\u0026fit=max\u0026auto=format\u0026n=0XJAojMwxBOWwfw5\u0026q=85\u0026s=8ed8c434c61ef9f3fbf0baa240f1ba57 280w, https://mintcdn.com/kodelabs/0XJAojMwxBOWwfw5/images/energ/energ-capital-planning-measure-creation.png?w=560\u0026fit=max\u0026auto=format\u0026n=0XJAojMwxBOWwfw5\u0026q=85\u0026s=cc39c018794315cbaf4b18ac49214522 560w, https://mintcdn.com/kodelabs/0XJAojMwxBOWwfw5/images/energ/energ-capital-planning-measure-creation.png?w=840\u0026fit=max\u0026auto=format\u0026n=0XJAojMwxBOWwfw5\u0026q=85\u0026s=a1a23108eee09eb1514b6d227785a49f 840w, https://mintcdn.com/kodelabs/0XJAojMwxBOWwfw5/images/energ/energ-capital-planning-measure-creation.png?w=1100\u0026fit=max\u0026auto=format\u0026n=0XJAojMwxBOWwfw5\u0026q=85\u0026s=dd6445b04c8ca3d3830058e8250d0739 1100w, https://mintcdn.com/kodelabs/0XJAojMwxBOWwfw5/images/energ/energ-capital-planning-measure-creation.png?w=1650\u0026fit=max\u0026auto=format\u0026n=0XJAojMwxBOWwfw5\u0026q=85\u0026s=594866a48dcb14e3e601117c9099dab0 1650w, https://mintcdn.com/kodelabs/0XJAojMwxBOWwfw5/images/energ/energ-capital-planning-measure-creation.png?w=2500\u0026fit=max\u0026auto=format\u0026n=0XJAojMwxBOWwfw5\u0026q=85\u0026s=fb7b8ac2a64698e6b1e1b7a8e0d1ed59 2500w`})}),`\n`,_jsx(Heading,{level:`3`,id:`add-a-new-measure`,children:`Add a new measure`}),`\n`,_jsxs(_components.p,{children:[`Click `,_jsx(_components.strong,{children:`+ Add new Measure`}),` to open the `,_jsx(_components.strong,{children:`Add New Measure`}),` panel.`]}),`\n`,_jsx(Frame,{caption:`Add New Measure panel with category, curve, and savings fields`,children:_jsx(OptimizedImage,{src:`https://mintcdn.com/kodelabs/0XJAojMwxBOWwfw5/images/energ/energ-capital-planning-add-measure.png?fit=max\u0026auto=format\u0026n=0XJAojMwxBOWwfw5\u0026q=85\u0026s=3f748336041baa029c79d75bfd55f501`,alt:`Add New Measure side panel with Measure Name Primary Category Curve Status Service Types under Annual Savings Capital Cost Incentive Amount Incentive Source and Close Save buttons`,\"data-og-width\":`852`,width:`852`,\"data-og-height\":`914`,height:`914`,\"data-path\":`images/energ/energ-capital-planning-add-measure.png`,\"data-optimize\":`true`,\"data-opv\":`3`,srcset:`https://mintcdn.com/kodelabs/0XJAojMwxBOWwfw5/images/energ/energ-capital-planning-add-measure.png?w=280\u0026fit=max\u0026auto=format\u0026n=0XJAojMwxBOWwfw5\u0026q=85\u0026s=1a5a09c941ac96cb778993d329fc7c4a 280w, https://mintcdn.com/kodelabs/0XJAojMwxBOWwfw5/images/energ/energ-capital-planning-add-measure.png?w=560\u0026fit=max\u0026auto=format\u0026n=0XJAojMwxBOWwfw5\u0026q=85\u0026s=33ed5ea7d3b8dc91f1e2306debf44737 560w, https://mintcdn.com/kodelabs/0XJAojMwxBOWwfw5/images/energ/energ-capital-planning-add-measure.png?w=840\u0026fit=max\u0026auto=format\u0026n=0XJAojMwxBOWwfw5\u0026q=85\u0026s=ec4e58d6266c4a65f1604a6ca5ba16b3 840w, https://mintcdn.com/kodelabs/0XJAojMwxBOWwfw5/images/energ/energ-capital-planning-add-measure.png?w=1100\u0026fit=max\u0026auto=format\u0026n=0XJAojMwxBOWwfw5\u0026q=85\u0026s=1c7d80214319fa82fd65cabdb6d73cb0 1100w, https://mintcdn.com/kodelabs/0XJAojMwxBOWwfw5/images/energ/energ-capital-planning-add-measure.png?w=1650\u0026fit=max\u0026auto=format\u0026n=0XJAojMwxBOWwfw5\u0026q=85\u0026s=3b72637209237b9381dc79efec4bf83e 1650w, https://mintcdn.com/kodelabs/0XJAojMwxBOWwfw5/images/energ/energ-capital-planning-add-measure.png?w=2500\u0026fit=max\u0026auto=format\u0026n=0XJAojMwxBOWwfw5\u0026q=85\u0026s=164717b9359f0d9b7695f15fd5628af7 2500w`})}),`\n`,_jsxs(Table,{children:[_jsx(_components.thead,{children:_jsxs(_components.tr,{children:[_jsx(_components.th,{children:`Field`}),_jsx(_components.th,{children:`Purpose`})]})}),_jsxs(_components.tbody,{children:[_jsxs(_components.tr,{children:[_jsx(_components.td,{children:_jsx(_components.strong,{children:`Measure Name`})}),_jsx(_components.td,{children:`Project label shown in the measures table`})]}),_jsxs(_components.tr,{children:[_jsx(_components.td,{children:_jsx(_components.strong,{children:`Primary Category`})}),_jsxs(_components.td,{children:[`Grouping such as `,_jsx(_components.strong,{children:`Lighting Systems`}),` or `,_jsx(_components.strong,{children:`HVAC Systems`})]})]}),_jsxs(_components.tr,{children:[_jsx(_components.td,{children:_jsx(_components.strong,{children:`Curve`})}),_jsxs(_components.td,{children:[`Distribution curve from the table below, such as `,_jsx(_components.strong,{children:`Flat`}),` or `,_jsx(_components.strong,{children:`Heating`})]})]}),_jsxs(_components.tr,{children:[_jsx(_components.td,{children:_jsx(_components.strong,{children:`Status`})}),_jsxs(_components.td,{children:[_jsx(_components.strong,{children:`Planning`}),`, `,_jsx(_components.strong,{children:`Implementation`}),`, or `,_jsx(_components.strong,{children:`Operations`})]})]}),_jsxs(_components.tr,{children:[_jsx(_components.td,{children:_jsx(_components.strong,{children:`Service Types`})}),_jsx(_components.td,{children:`Fuels affected by the measure`})]}),_jsxs(_components.tr,{children:[_jsx(_components.td,{children:_jsx(_components.strong,{children:`Capital Cost ($)`})}),_jsx(_components.td,{children:`Upfront project cost`})]}),_jsxs(_components.tr,{children:[_jsx(_components.td,{children:_jsx(_components.strong,{children:`Incentive Amount ($)`})}),_jsx(_components.td,{children:`Rebates or grants applied to payback`})]}),_jsxs(_components.tr,{children:[_jsx(_components.td,{children:_jsx(_components.strong,{children:`Incentive Source`})}),_jsx(_components.td,{children:`Program or funder name for audit trails`})]})]})]}),`\n`,_jsxs(_components.p,{children:[`Click `,_jsx(_components.strong,{children:`Save`}),` to add the row. EnerG calculates payback and fuel-specific savings columns after you save. Additional fields may appear when you select multiple service types.`]}),`\n`,_jsx(Heading,{level:`3`,id:`create-a-custom-curve`,children:`Create a custom curve`}),`\n`,_jsxs(_components.p,{children:[`Click `,_jsx(_components.strong,{children:`+ Add new Curve`}),` to open the `,_jsx(_components.strong,{children:`Create Custom Curve`}),` panel when default cooling, heating, or flat curves do not fit your measure.`]}),`\n`,_jsx(Frame,{caption:`Create Custom Curve panel with monthly factors`,children:_jsx(OptimizedImage,{src:`https://mintcdn.com/kodelabs/0XJAojMwxBOWwfw5/images/energ/energ-capital-planning-create-curve.png?fit=max\u0026auto=format\u0026n=0XJAojMwxBOWwfw5\u0026q=85\u0026s=7a0950b3a6845c7e6b54fd16c3804abe`,alt:`Create Custom Curve side panel with banner Monthly values must total 1.000 Curve Name Curve Type twelve monthly fields Total Sum 0.00 Sum less than 1 validation and Close Create Curve buttons`,\"data-og-width\":`890`,width:`890`,\"data-og-height\":`876`,height:`876`,\"data-path\":`images/energ/energ-capital-planning-create-curve.png`,\"data-optimize\":`true`,\"data-opv\":`3`,srcset:`https://mintcdn.com/kodelabs/0XJAojMwxBOWwfw5/images/energ/energ-capital-planning-create-curve.png?w=280\u0026fit=max\u0026auto=format\u0026n=0XJAojMwxBOWwfw5\u0026q=85\u0026s=800b25145f55d68e6472053fab035685 280w, https://mintcdn.com/kodelabs/0XJAojMwxBOWwfw5/images/energ/energ-capital-planning-create-curve.png?w=560\u0026fit=max\u0026auto=format\u0026n=0XJAojMwxBOWwfw5\u0026q=85\u0026s=0d2b87f3971531906ba1def7abe12b20 560w, https://mintcdn.com/kodelabs/0XJAojMwxBOWwfw5/images/energ/energ-capital-planning-create-curve.png?w=840\u0026fit=max\u0026auto=format\u0026n=0XJAojMwxBOWwfw5\u0026q=85\u0026s=c45196e4b0492f17104ccc633fdfe480 840w, https://mintcdn.com/kodelabs/0XJAojMwxBOWwfw5/images/energ/energ-capital-planning-create-curve.png?w=1100\u0026fit=max\u0026auto=format\u0026n=0XJAojMwxBOWwfw5\u0026q=85\u0026s=530a1b6f15bdf05fb0bb94369b50d8dc 1100w, https://mintcdn.com/kodelabs/0XJAojMwxBOWwfw5/images/energ/energ-capital-planning-create-curve.png?w=1650\u0026fit=max\u0026auto=format\u0026n=0XJAojMwxBOWwfw5\u0026q=85\u0026s=5457a5d0ff3a7e2adf26fb6f79bdb718 1650w, https://mintcdn.com/kodelabs/0XJAojMwxBOWwfw5/images/energ/energ-capital-planning-create-curve.png?w=2500\u0026fit=max\u0026auto=format\u0026n=0XJAojMwxBOWwfw5\u0026q=85\u0026s=12937a7262423cc531fdd4a05c10d103 2500w`})}),`\n`,_jsxs(Table,{children:[_jsx(_components.thead,{children:_jsxs(_components.tr,{children:[_jsx(_components.th,{children:`Field`}),_jsx(_components.th,{children:`Purpose`})]})}),_jsxs(_components.tbody,{children:[_jsxs(_components.tr,{children:[_jsx(_components.td,{children:_jsx(_components.strong,{children:`Curve Name`})}),_jsxs(_components.td,{children:[`Label in the `,_jsx(_components.strong,{children:`Distribution Curves`}),` table`]})]}),_jsxs(_components.tr,{children:[_jsx(_components.td,{children:_jsx(_components.strong,{children:`Curve Type`})}),_jsx(_components.td,{children:`Curve family EnerG uses for allocation logic`})]}),_jsxs(_components.tr,{children:[_jsx(_components.td,{children:_jsx(_components.strong,{children:`January – December`})}),_jsx(_components.td,{children:`Monthly factor for each month`})]})]})]}),`\n`,_jsx(Warning,{children:_jsxs(_components.p,{children:[`Monthly values must total `,_jsx(_components.strong,{children:`1.000`}),` for annual distribution. The footer shows `,_jsx(_components.strong,{children:`Total Sum`}),` and a validation message until the monthly factors sum to one.`]})}),`\n`,_jsxs(_components.p,{children:[`Click `,_jsx(_components.strong,{children:`Create Curve`}),` when the sum reaches `,_jsx(_components.strong,{children:`1.000`}),`. The new curve appears in the `,_jsx(_components.strong,{children:`Curve`}),` dropdown on `,_jsx(_components.strong,{children:`Add New Measure`}),`.`]}),`\n`,_jsx(Heading,{level:`3`,id:`measures-table`,children:`Measures table`}),`\n`,_jsxs(_components.p,{children:[`The `,_jsx(_components.strong,{children:`Measures`}),` table lists every conservation project for the building. Scroll horizontally to see financial and fuel-specific columns.`]}),`\n`,_jsxs(Table,{children:[_jsx(_components.thead,{children:_jsxs(_components.tr,{children:[_jsx(_components.th,{children:`Column`}),_jsx(_components.th,{children:`What it shows`})]})}),_jsxs(_components.tbody,{children:[_jsxs(_components.tr,{children:[_jsx(_components.td,{children:_jsx(_components.strong,{children:`Building Name`})}),_jsx(_components.td,{children:`Site the measure applies to`})]}),_jsxs(_components.tr,{children:[_jsx(_components.td,{children:_jsx(_components.strong,{children:`Measure Name`})}),_jsxs(_components.td,{children:[`Project label, such as `,_jsx(_components.strong,{children:`LED Lighting Retrofit with Controls`})]})]}),_jsxs(_components.tr,{children:[_jsx(_components.td,{children:_jsx(_components.strong,{children:`Measure Type`})}),_jsxs(_components.td,{children:[`Specific technology, such as `,_jsx(_components.strong,{children:`Interior and Exterior Lighting`})]})]}),_jsxs(_components.tr,{children:[_jsx(_components.td,{children:_jsx(_components.strong,{children:`Status`})}),_jsxs(_components.td,{children:[`Lifecycle state, such as `,_jsx(_components.strong,{children:`Planning`}),`, `,_jsx(_components.strong,{children:`Implementation`}),`, or `,_jsx(_components.strong,{children:`Operations`})]})]}),_jsxs(_components.tr,{children:[_jsx(_components.td,{children:_jsx(_components.strong,{children:`Primary Category`})}),_jsxs(_components.td,{children:[`Grouping, such as `,_jsx(_components.strong,{children:`Lighting Systems`}),` or `,_jsx(_components.strong,{children:`HVAC Systems`})]})]}),_jsxs(_components.tr,{children:[_jsx(_components.td,{children:_jsx(_components.strong,{children:`Total Savings`})}),_jsxs(_components.td,{children:[`Annual energy reduction, such as `,_jsx(_components.strong,{children:`538,200 kWh`})]})]}),_jsxs(_components.tr,{children:[_jsx(_components.td,{children:_jsx(_components.strong,{children:`Cost Savings`})}),_jsxs(_components.td,{children:[`Annual cost impact, such as `,_jsx(_components.strong,{children:`$75,348`})]})]}),_jsxs(_components.tr,{children:[_jsx(_components.td,{children:_jsx(_components.strong,{children:`Electric Saving`})}),_jsx(_components.td,{children:`Electric commodity savings when applicable`})]}),_jsxs(_components.tr,{children:[_jsx(_components.td,{children:_jsx(_components.strong,{children:`Water Saving`})}),_jsx(_components.td,{children:`Water savings when applicable`})]}),_jsxs(_components.tr,{children:[_jsx(_components.td,{children:_jsx(_components.strong,{children:`District Steam Saving`})}),_jsx(_components.td,{children:`Steam savings when applicable`})]}),_jsxs(_components.tr,{children:[_jsx(_components.td,{children:_jsx(_components.strong,{children:`Consumption Savings`})}),_jsx(_components.td,{children:`Combined consumption impact across fuels`})]}),_jsxs(_components.tr,{children:[_jsx(_components.td,{children:_jsx(_components.strong,{children:`Payback (Years)`})}),_jsx(_components.td,{children:`Simple payback from capital cost, incentives, and savings`})]}),_jsxs(_components.tr,{children:[_jsx(_components.td,{children:_jsx(_components.strong,{children:`Capital Cost`})}),_jsxs(_components.td,{children:[`Upfront project cost, such as `,_jsx(_components.strong,{children:`$285,000`})]})]}),_jsxs(_components.tr,{children:[_jsx(_components.td,{children:_jsx(_components.strong,{children:`Incentive Amount`})}),_jsxs(_components.td,{children:[`Rebates or grants, such as `,_jsx(_components.strong,{children:`$64,600`})]})]}),_jsxs(_components.tr,{children:[_jsx(_components.td,{children:_jsx(_components.strong,{children:`Actions`})}),_jsx(_components.td,{children:`Edit or delete the measure`})]})]})]}),`\n`,_jsx(Warning,{children:_jsxs(_components.p,{children:[`Set `,_jsx(_components.strong,{children:`Operations`}),` status only when the `,_jsx(_components.strong,{children:`operation date`}),` is in the past and savings have started.`]})}),`\n`,_jsxs(_components.p,{children:[`When a measure reaches `,_jsx(_components.strong,{children:`Operations`}),`, EnerG can connect it to `,_jsx(_components.a,{href:`/products/energ/energy-modeling/mv-models`,children:`M\u0026V models`}),`. Keep the measure record aligned with the meters and models that prove savings.`]}),`\n`,_jsx(Heading,{level:`3`,id:`distribution-curves`,children:`Distribution curves`}),`\n`,_jsxs(_components.p,{children:[`The `,_jsx(_components.strong,{children:`Distribution Curves`}),` table defines how annual savings spread across months. EnerG provides default cooling, heating, and flat curves derived from degree-day logic on `,_jsx(_components.a,{href:`#define-baseline-period`,children:`Basic Information`}),`.`]}),`\n`,_jsxs(Table,{children:[_jsx(_components.thead,{children:_jsxs(_components.tr,{children:[_jsx(_components.th,{children:`Column`}),_jsx(_components.th,{children:`What it shows`})]})}),_jsxs(_components.tbody,{children:[_jsxs(_components.tr,{children:[_jsx(_components.td,{children:_jsx(_components.strong,{children:`Name`})}),_jsxs(_components.td,{children:[`Curve label, such as `,_jsx(_components.strong,{children:`Cooling (CDD 65°F)`}),`, `,_jsx(_components.strong,{children:`Heating (HDD 65°F)`}),`, or `,_jsx(_components.strong,{children:`Flat (1/12)`})]})]}),_jsxs(_components.tr,{children:[_jsx(_components.td,{children:_jsx(_components.strong,{children:`Curves`})}),_jsxs(_components.td,{children:[`Curve family: `,_jsx(_components.strong,{children:`Cooling`}),`, `,_jsx(_components.strong,{children:`Heating`}),`, or `,_jsx(_components.strong,{children:`Flat`})]})]}),_jsxs(_components.tr,{children:[_jsx(_components.td,{children:_jsx(_components.strong,{children:`Jan – Dec`})}),_jsx(_components.td,{children:`Monthly factor that sums to the annual savings profile`})]})]})]}),`\n`,_jsxs(_components.p,{children:[`Assign a curve when you create or edit a measure so EnerG allocates savings without manual spreadsheet work. For when to use each curve type, see `,_jsx(_components.a,{href:`/products/energ/reference/calculations-and-parameters#distribution-curves`,children:`Distribution curves`}),`.`]}),`\n`,_jsx(Heading,{level:`2`,id:`scenario-planner`,children:`Scenario Planner`}),`\n`,_jsxs(_components.p,{children:[`Select `,_jsx(_components.strong,{children:`Scenario Planner`}),` in the Capital Planning menu to bundle measures into funding packages. Each scenario lists included measures with implementation and operation dates.`]}),`\n`,_jsx(Frame,{caption:`Scenario Planner with expandable scenario cards`,children:_jsx(OptimizedImage,{src:`https://mintcdn.com/kodelabs/Ph3_DUgZdP7vM-lt/images/energ/energ-capital-planning-scenario-planner.png?fit=max\u0026auto=format\u0026n=Ph3_DUgZdP7vM-lt\u0026q=85\u0026s=d0ed723a6d0fec20eca9e8a38a1cbcc1`,alt:`Scenario Planner page showing LED Only High priority scenario with one measure Full retrofit Medium priority with five measures and implementation and operation dates and Edit Scenario buttons`,\"data-og-width\":`1024`,width:`1024`,\"data-og-height\":`611`,height:`611`,\"data-path\":`images/energ/energ-capital-planning-scenario-planner.png`,\"data-optimize\":`true`,\"data-opv\":`3`,srcset:`https://mintcdn.com/kodelabs/Ph3_DUgZdP7vM-lt/images/energ/energ-capital-planning-scenario-planner.png?w=280\u0026fit=max\u0026auto=format\u0026n=Ph3_DUgZdP7vM-lt\u0026q=85\u0026s=dd6efcd8255da16b450b8aaf6409b67f 280w, https://mintcdn.com/kodelabs/Ph3_DUgZdP7vM-lt/images/energ/energ-capital-planning-scenario-planner.png?w=560\u0026fit=max\u0026auto=format\u0026n=Ph3_DUgZdP7vM-lt\u0026q=85\u0026s=d7243e9bd8705da9b91a668115244560 560w, https://mintcdn.com/kodelabs/Ph3_DUgZdP7vM-lt/images/energ/energ-capital-planning-scenario-planner.png?w=840\u0026fit=max\u0026auto=format\u0026n=Ph3_DUgZdP7vM-lt\u0026q=85\u0026s=d170f47b2f5ab7ab528205573c85b917 840w, https://mintcdn.com/kodelabs/Ph3_DUgZdP7vM-lt/images/energ/energ-capital-planning-scenario-planner.png?w=1100\u0026fit=max\u0026auto=format\u0026n=Ph3_DUgZdP7vM-lt\u0026q=85\u0026s=2cf0433be1c6de1ac9a7f77e2a4b0eb6 1100w, https://mintcdn.com/kodelabs/Ph3_DUgZdP7vM-lt/images/energ/energ-capital-planning-scenario-planner.png?w=1650\u0026fit=max\u0026auto=format\u0026n=Ph3_DUgZdP7vM-lt\u0026q=85\u0026s=cb9550d327a41e2cff73c5d94773b89b 1650w, https://mintcdn.com/kodelabs/Ph3_DUgZdP7vM-lt/images/energ/energ-capital-planning-scenario-planner.png?w=2500\u0026fit=max\u0026auto=format\u0026n=Ph3_DUgZdP7vM-lt\u0026q=85\u0026s=d550bec538eb1bcc53fff44508b95c11 2500w`})}),`\n`,_jsxs(_components.p,{children:[`Click `,_jsx(_components.strong,{children:`+ Add new Scenario`}),` to create a bundle. Expand a card to review measures or click `,_jsx(_components.strong,{children:`Edit Scenario`}),` to change dates and membership.`]}),`\n`,_jsx(Heading,{level:`3`,id:`scenario-cards`,children:`Scenario cards`}),`\n`,_jsxs(_components.p,{children:[`Each card shows the scenario name, a `,_jsx(_components.strong,{children:`priority`}),` tag, and a table of measures when expanded.`]}),`\n`,_jsxs(Table,{children:[_jsx(_components.thead,{children:_jsxs(_components.tr,{children:[_jsx(_components.th,{children:`Element`}),_jsx(_components.th,{children:`What it shows`})]})}),_jsxs(_components.tbody,{children:[_jsxs(_components.tr,{children:[_jsx(_components.td,{children:_jsx(_components.strong,{children:`Scenario name`})}),_jsxs(_components.td,{children:[`Bundle label, such as `,_jsx(_components.strong,{children:`LED Only`}),` or `,_jsx(_components.strong,{children:`Full retrofit`})]})]}),_jsxs(_components.tr,{children:[_jsx(_components.td,{children:_jsx(_components.strong,{children:`Priority`})}),_jsxs(_components.td,{children:[_jsx(_components.strong,{children:`High`}),`, `,_jsx(_components.strong,{children:`Medium`}),`, or `,_jsx(_components.strong,{children:`Low`}),` planning priority`]})]}),_jsxs(_components.tr,{children:[_jsx(_components.td,{children:_jsx(_components.strong,{children:`Measure Name`})}),_jsx(_components.td,{children:`Measure included in the bundle`})]}),_jsxs(_components.tr,{children:[_jsx(_components.td,{children:_jsx(_components.strong,{children:`Measure Status`})}),_jsxs(_components.td,{children:[`Status of each measure, such as `,_jsx(_components.strong,{children:`Planning`})]})]}),_jsxs(_components.tr,{children:[_jsx(_components.td,{children:_jsx(_components.strong,{children:`Implementation Date`})}),_jsx(_components.td,{children:`When work begins`})]}),_jsxs(_components.tr,{children:[_jsx(_components.td,{children:_jsx(_components.strong,{children:`Operation Date`})}),_jsx(_components.td,{children:`When savings start in reporting`})]}),_jsxs(_components.tr,{children:[_jsx(_components.td,{children:_jsx(_components.strong,{children:`Edit Scenario`})}),_jsx(_components.td,{children:`Opens the scenario for changes`})]})]})]}),`\n`,_jsx(Note,{children:_jsxs(_components.p,{children:[_jsx(_components.strong,{children:`Implementation date`}),` marks construction or install start. `,_jsx(_components.strong,{children:`Operation date`}),` marks when savings first count in forecasts and analysis.`]})}),`\n`,_jsx(Heading,{level:`3`,id:`create-a-scenario`,children:`Create a scenario`}),`\n`,_jsxs(_components.p,{children:[`Click `,_jsx(_components.strong,{children:`+ Add new Scenario`}),` to open the `,_jsx(_components.strong,{children:`Create Scenario`}),` panel.`]}),`\n`,_jsx(Frame,{caption:`Create Scenario panel with measure selection`,children:_jsx(OptimizedImage,{src:`https://mintcdn.com/kodelabs/0XJAojMwxBOWwfw5/images/energ/energ-capital-planning-create-scenario.png?fit=max\u0026auto=format\u0026n=0XJAojMwxBOWwfw5\u0026q=85\u0026s=f31f780dc367f5990548d95b33606743`,alt:`Create Scenario side panel with Scenario Name Priority dropdown and checklist of energy conservation measures with curve tags such as Flat Cooling and Heating and Close Create Scenario buttons`,\"data-og-width\":`889`,width:`889`,\"data-og-height\":`903`,height:`903`,\"data-path\":`images/energ/energ-capital-planning-create-scenario.png`,\"data-optimize\":`true`,\"data-opv\":`3`,srcset:`https://mintcdn.com/kodelabs/0XJAojMwxBOWwfw5/images/energ/energ-capital-planning-create-scenario.png?w=280\u0026fit=max\u0026auto=format\u0026n=0XJAojMwxBOWwfw5\u0026q=85\u0026s=539cfe3f6ea1402e234f4fd25d78b967 280w, https://mintcdn.com/kodelabs/0XJAojMwxBOWwfw5/images/energ/energ-capital-planning-create-scenario.png?w=560\u0026fit=max\u0026auto=format\u0026n=0XJAojMwxBOWwfw5\u0026q=85\u0026s=692b811d3db0129b0b57b02e2ff8feca 560w, https://mintcdn.com/kodelabs/0XJAojMwxBOWwfw5/images/energ/energ-capital-planning-create-scenario.png?w=840\u0026fit=max\u0026auto=format\u0026n=0XJAojMwxBOWwfw5\u0026q=85\u0026s=50a141facc7b2f97b19eb7ea5135d86b 840w, https://mintcdn.com/kodelabs/0XJAojMwxBOWwfw5/images/energ/energ-capital-planning-create-scenario.png?w=1100\u0026fit=max\u0026auto=format\u0026n=0XJAojMwxBOWwfw5\u0026q=85\u0026s=531d30dc026dba2796f8a6b274fbeef4 1100w, https://mintcdn.com/kodelabs/0XJAojMwxBOWwfw5/images/energ/energ-capital-planning-create-scenario.png?w=1650\u0026fit=max\u0026auto=format\u0026n=0XJAojMwxBOWwfw5\u0026q=85\u0026s=244a297b2acd17b9346890fd81bc1ea9 1650w, https://mintcdn.com/kodelabs/0XJAojMwxBOWwfw5/images/energ/energ-capital-planning-create-scenario.png?w=2500\u0026fit=max\u0026auto=format\u0026n=0XJAojMwxBOWwfw5\u0026q=85\u0026s=d0a9dfc659dc40a4ba729dd482ae986b 2500w`})}),`\n`,_jsxs(Table,{children:[_jsx(_components.thead,{children:_jsxs(_components.tr,{children:[_jsx(_components.th,{children:`Field`}),_jsx(_components.th,{children:`Purpose`})]})}),_jsxs(_components.tbody,{children:[_jsxs(_components.tr,{children:[_jsx(_components.td,{children:_jsx(_components.strong,{children:`Scenario Name`})}),_jsx(_components.td,{children:`Label on the scenario card`})]}),_jsxs(_components.tr,{children:[_jsx(_components.td,{children:_jsx(_components.strong,{children:`Priority`})}),_jsxs(_components.td,{children:[_jsx(_components.strong,{children:`High`}),`, `,_jsx(_components.strong,{children:`Medium`}),`, or `,_jsx(_components.strong,{children:`Low`})]})]}),_jsxs(_components.tr,{children:[_jsx(_components.td,{children:_jsx(_components.strong,{children:`Select Energy Conservation Measures`})}),_jsxs(_components.td,{children:[`Check each measure to include. Tags show the assigned curve, such as `,_jsx(_components.strong,{children:`Flat (1/12)`}),` or `,_jsx(_components.strong,{children:`Cooling (CDD 65°F)`})]})]})]})]}),`\n`,_jsxs(_components.p,{children:[`Click `,_jsx(_components.strong,{children:`Create Scenario`}),`, then open `,_jsx(_components.strong,{children:`Edit Scenario`}),` on the card to set `,_jsx(_components.strong,{children:`Implementation Date`}),` and `,_jsx(_components.strong,{children:`Operation Date`}),` per measure when projects phase over time.`]}),`\n`,_jsxs(_components.p,{children:[`Review savings and payback on `,_jsx(_components.a,{href:`#scenario-analysis`,children:`Scenario Analysis`}),`. Compare bundles on `,_jsx(_components.strong,{children:`Comparison`}),` or at the portfolio on `,_jsx(_components.a,{href:`/products/energ/analytics/portfolio-capital-planning`,children:`Portfolio capital planning`}),`.`]}),`\n`,_jsx(Heading,{level:`2`,id:`scenario-analysis`,children:`Scenario Analysis`}),`\n`,_jsxs(_components.p,{children:[`Select `,_jsx(_components.strong,{children:`Scenario Analysis`}),` in the Capital Planning menu to review financial and environmental impacts for a scenario you built on `,_jsx(_components.a,{href:`#scenario-planner`,children:`Scenario Planner`}),`.`]}),`\n`,_jsx(Frame,{caption:`Scenario Analysis with KPI cards and Target chart`,children:_jsx(OptimizedImage,{src:`https://mintcdn.com/kodelabs/0XJAojMwxBOWwfw5/images/energ/energ-capital-planning-scenario-analysis.png?fit=max\u0026auto=format\u0026n=0XJAojMwxBOWwfw5\u0026q=85\u0026s=d9af811434abd12fbf8af5a26c4e1c50`,alt:`Scenario Analysis page for LED Only scenario with Consumption Cost Emissions toggles showing Projected Annual Reduction 538200 kWh Percent Reduction 12.02 percent Payback 2.93 years Capital Cost 285000 Incentives 64600 and Target chart with TTM Baseline Forecast TTM Target Final and Target Rolling lines to 2040`,\"data-og-width\":`1024`,width:`1024`,\"data-og-height\":`595`,height:`595`,\"data-path\":`images/energ/energ-capital-planning-scenario-analysis.png`,\"data-optimize\":`true`,\"data-opv\":`3`,srcset:`https://mintcdn.com/kodelabs/0XJAojMwxBOWwfw5/images/energ/energ-capital-planning-scenario-analysis.png?w=280\u0026fit=max\u0026auto=format\u0026n=0XJAojMwxBOWwfw5\u0026q=85\u0026s=c9788adf9e1dbb18afd7f552af7c1283 280w, https://mintcdn.com/kodelabs/0XJAojMwxBOWwfw5/images/energ/energ-capital-planning-scenario-analysis.png?w=560\u0026fit=max\u0026auto=format\u0026n=0XJAojMwxBOWwfw5\u0026q=85\u0026s=9d64621ae5db8c1019a554225a7408c4 560w, https://mintcdn.com/kodelabs/0XJAojMwxBOWwfw5/images/energ/energ-capital-planning-scenario-analysis.png?w=840\u0026fit=max\u0026auto=format\u0026n=0XJAojMwxBOWwfw5\u0026q=85\u0026s=b32934b146b489a20425cbff88478fdb 840w, https://mintcdn.com/kodelabs/0XJAojMwxBOWwfw5/images/energ/energ-capital-planning-scenario-analysis.png?w=1100\u0026fit=max\u0026auto=format\u0026n=0XJAojMwxBOWwfw5\u0026q=85\u0026s=3b10025b48af860f30af727d5e929d43 1100w, https://mintcdn.com/kodelabs/0XJAojMwxBOWwfw5/images/energ/energ-capital-planning-scenario-analysis.png?w=1650\u0026fit=max\u0026auto=format\u0026n=0XJAojMwxBOWwfw5\u0026q=85\u0026s=5e33e235ccd80b25aa037aff52067e61 1650w, https://mintcdn.com/kodelabs/0XJAojMwxBOWwfw5/images/energ/energ-capital-planning-scenario-analysis.png?w=2500\u0026fit=max\u0026auto=format\u0026n=0XJAojMwxBOWwfw5\u0026q=85\u0026s=34b28603ab1000b8a526408a9d437b35 2500w`})}),`\n`,_jsx(Heading,{level:`3`,id:`page-controls`,children:`Page controls`}),`\n`,_jsxs(Table,{children:[_jsx(_components.thead,{children:_jsxs(_components.tr,{children:[_jsx(_components.th,{children:`Control`}),_jsx(_components.th,{children:`Purpose`})]})}),_jsxs(_components.tbody,{children:[_jsxs(_components.tr,{children:[_jsxs(_components.td,{children:[_jsx(_components.strong,{children:`Consumption`}),` / `,_jsx(_components.strong,{children:`Cost`}),` / `,_jsx(_components.strong,{children:`Emissions`})]}),_jsx(_components.td,{children:`Switch KPI cards and charts between usage, spend, and kgCO₂e`})]}),_jsxs(_components.tr,{children:[_jsx(_components.td,{children:_jsx(_components.strong,{children:`Energy`})}),_jsx(_components.td,{children:`Filter by energy scope or commodity`})]}),_jsxs(_components.tr,{children:[_jsx(_components.td,{children:_jsx(_components.strong,{children:`Scenario`})}),_jsxs(_components.td,{children:[`Select the scenario to analyze, such as `,_jsx(_components.strong,{children:`LED Only`})]})]}),_jsxs(_components.tr,{children:[_jsx(_components.td,{children:_jsx(_components.strong,{children:`Measures`})}),_jsx(_components.td,{children:`Multi-select measures within the scenario`})]})]})]}),`\n`,_jsx(Heading,{level:`3`,id:`summary-metrics`,children:`Summary metrics`}),`\n`,_jsx(_components.p,{children:`Five cards roll up results for the active scenario and view.`}),`\n`,_jsxs(Table,{children:[_jsx(_components.thead,{children:_jsxs(_components.tr,{children:[_jsx(_components.th,{children:`Card`}),_jsx(_components.th,{children:`What it shows`})]})}),_jsxs(_components.tbody,{children:[_jsxs(_components.tr,{children:[_jsx(_components.td,{children:_jsx(_components.strong,{children:`Projected Annual Reduction`})}),_jsxs(_components.td,{children:[`Total annual savings, such as `,_jsx(_components.strong,{children:`538,200 kWh`})]})]}),_jsxs(_components.tr,{children:[_jsx(_components.td,{children:_jsx(_components.strong,{children:`Percent Reduction`})}),_jsxs(_components.td,{children:[`Savings as a percent of baseline, such as `,_jsx(_components.strong,{children:`12.02%`})]})]}),_jsxs(_components.tr,{children:[_jsx(_components.td,{children:_jsx(_components.strong,{children:`Projected Payback Period`})}),_jsxs(_components.td,{children:[`Simple payback in years, such as `,_jsx(_components.strong,{children:`2.93`})]})]}),_jsxs(_components.tr,{children:[_jsx(_components.td,{children:_jsx(_components.strong,{children:`Total Capital Cost`})}),_jsx(_components.td,{children:`Sum of measure capital costs`})]}),_jsxs(_components.tr,{children:[_jsx(_components.td,{children:_jsx(_components.strong,{children:`Total Incentives`})}),_jsx(_components.td,{children:`Sum of rebates and grants`})]})]})]}),`\n`,_jsx(Heading,{level:`3`,id:`target-chart`,children:`Target chart`}),`\n`,_jsxs(_components.p,{children:[`The `,_jsx(_components.strong,{children:`Target`}),` chart compares long-range trajectories through `,_jsx(_components.strong,{children:`2040`}),`.`]}),`\n`,_jsxs(Table,{children:[_jsx(_components.thead,{children:_jsxs(_components.tr,{children:[_jsx(_components.th,{children:`Series`}),_jsx(_components.th,{children:`Meaning`})]})}),_jsxs(_components.tbody,{children:[_jsxs(_components.tr,{children:[_jsx(_components.td,{children:_jsx(_components.strong,{children:`TTM Baseline`})}),_jsx(_components.td,{children:`Trailing-twelve-month baseline without measures`})]}),_jsxs(_components.tr,{children:[_jsx(_components.td,{children:_jsx(_components.strong,{children:`Forecast TTM`})}),_jsx(_components.td,{children:`Projected use after measures take effect`})]}),_jsxs(_components.tr,{children:[_jsx(_components.td,{children:_jsx(_components.strong,{children:`Target Final`})}),_jsxs(_components.td,{children:[`Long-term reduction goal, such as a `,_jsx(_components.strong,{children:`2040 Reduction Goal`})]})]}),_jsxs(_components.tr,{children:[_jsx(_components.td,{children:_jsx(_components.strong,{children:`Target Rolling`})}),_jsx(_components.td,{children:`Rolling path from baseline toward the final target`})]})]})]}),`\n`,_jsxs(_components.p,{children:[`Use the goal dropdown, such as `,_jsx(_components.strong,{children:`2040 Reduction Goal`}),`, to align the chart with targets you set on `,_jsx(_components.a,{href:`/products/energ/analytics/portfolio-targets`,children:`Portfolio targets`}),` and review on the `,_jsx(_components.a,{href:`/products/energ/analytics/building-dashboards-energy#target`,children:`Building Energy dashboard`}),`.`]}),`\n`,_jsx(Heading,{level:`3`,id:`baseline-vs-projected-and-measures-timeline`,children:`Baseline vs. projected and measures timeline`}),`\n`,_jsx(_components.p,{children:`Scroll below the Target chart for service-type breakdowns and a measure schedule.`}),`\n`,_jsx(Frame,{caption:`Scenario Analysis Baseline vs Projected chart Reduction table and Measures Timeline`,children:_jsx(OptimizedImage,{src:`https://mintcdn.com/kodelabs/0XJAojMwxBOWwfw5/images/energ/energ-capital-planning-scenario-analysis-detail.png?fit=max\u0026auto=format\u0026n=0XJAojMwxBOWwfw5\u0026q=85\u0026s=d36ebbe24b943795340f72d3f98bcf52`,alt:`Scenario Analysis detail with Baseline vs Projected bar chart for District Steam and Electric Reduction table showing 538200 kWh electric reduction and Measures Timeline with LED Lighting Retrofit vertical bar at July 2026`,\"data-og-width\":`1013`,width:`1013`,\"data-og-height\":`756`,height:`756`,\"data-path\":`images/energ/energ-capital-planning-scenario-analysis-detail.png`,\"data-optimize\":`true`,\"data-opv\":`3`,srcset:`https://mintcdn.com/kodelabs/0XJAojMwxBOWwfw5/images/energ/energ-capital-planning-scenario-analysis-detail.png?w=280\u0026fit=max\u0026auto=format\u0026n=0XJAojMwxBOWwfw5\u0026q=85\u0026s=bf424b65d71b1bb7b2ae700e719f75c3 280w, https://mintcdn.com/kodelabs/0XJAojMwxBOWwfw5/images/energ/energ-capital-planning-scenario-analysis-detail.png?w=560\u0026fit=max\u0026auto=format\u0026n=0XJAojMwxBOWwfw5\u0026q=85\u0026s=b5918d34bbfd3396f4882e0ca2854773 560w, https://mintcdn.com/kodelabs/0XJAojMwxBOWwfw5/images/energ/energ-capital-planning-scenario-analysis-detail.png?w=840\u0026fit=max\u0026auto=format\u0026n=0XJAojMwxBOWwfw5\u0026q=85\u0026s=255c2f81ff63ae94c92d661675a2bd75 840w, https://mintcdn.com/kodelabs/0XJAojMwxBOWwfw5/images/energ/energ-capital-planning-scenario-analysis-detail.png?w=1100\u0026fit=max\u0026auto=format\u0026n=0XJAojMwxBOWwfw5\u0026q=85\u0026s=eb99a322a8351465b4752f1127834efb 1100w, https://mintcdn.com/kodelabs/0XJAojMwxBOWwfw5/images/energ/energ-capital-planning-scenario-analysis-detail.png?w=1650\u0026fit=max\u0026auto=format\u0026n=0XJAojMwxBOWwfw5\u0026q=85\u0026s=7a4b95b913186e005673629d1ff6ebee 1650w, https://mintcdn.com/kodelabs/0XJAojMwxBOWwfw5/images/energ/energ-capital-planning-scenario-analysis-detail.png?w=2500\u0026fit=max\u0026auto=format\u0026n=0XJAojMwxBOWwfw5\u0026q=85\u0026s=1c4846fea984dcc4878426adc6759e1a 2500w`})}),`\n`,_jsxs(Table,{children:[_jsx(_components.thead,{children:_jsxs(_components.tr,{children:[_jsx(_components.th,{children:`Section`}),_jsx(_components.th,{children:`What it shows`})]})}),_jsxs(_components.tbody,{children:[_jsxs(_components.tr,{children:[_jsx(_components.td,{children:_jsx(_components.strong,{children:`Baseline vs. Projected`})}),_jsx(_components.td,{children:`Grouped bars by service type comparing baseline to projected use`})]}),_jsxs(_components.tr,{children:[_jsx(_components.td,{children:_jsx(_components.strong,{children:`Reduction`})}),_jsxs(_components.td,{children:[`Table with `,_jsx(_components.strong,{children:`Baseline`}),`, `,_jsx(_components.strong,{children:`% of Baseline`}),`, `,_jsx(_components.strong,{children:`Projected`}),`, and `,_jsx(_components.strong,{children:`Reduction`}),` per fuel`]})]}),_jsxs(_components.tr,{children:[_jsx(_components.td,{children:_jsx(_components.strong,{children:`Measures Timeline`})}),_jsxs(_components.td,{children:[`Gantt-style view of when each measure starts savings based on `,_jsx(_components.strong,{children:`Operation Date`})]})]})]})]}),`\n`,_jsxs(_components.p,{children:[_jsx(_components.strong,{children:`Scenario Analysis`}),` shows trailing-twelve-month `,_jsx(_components.strong,{children:`Forecast TTM`}),` and baseline separation for one scenario. Use it when you explain how savings emerge across seasons before you compare bundles on `,_jsx(_components.strong,{children:`Comparison`}),`.`]}),`\n`,_jsx(Accordion,{title:`When you stagger implementation dates`,id:`when-you-stagger-implementation-dates`,children:_jsxs(_components.p,{children:[`Set each measure `,_jsx(_components.strong,{children:`Implementation Date`}),` when work begins and `,_jsx(_components.strong,{children:`Operation Date`}),` when savings start. Staggered dates keep cash flows and contractor access realistic in one scenario.`]})}),`\n`,_jsx(Heading,{level:`2`,id:`scenario-comparison`,children:`Scenario Comparison`}),`\n`,_jsxs(_components.p,{children:[`Select `,_jsx(_components.strong,{children:`Comparison`}),` in the Capital Planning menu to evaluate multiple scenarios side by side on one chart and table.`]}),`\n`,_jsx(Frame,{caption:`Scenario Comparison with Capital Planning Roadmap and comparison table`,children:_jsx(OptimizedImage,{src:`https://mintcdn.com/kodelabs/Ph3_DUgZdP7vM-lt/images/energ/energ-capital-planning-scenario-comparison.png?fit=max\u0026auto=format\u0026n=Ph3_DUgZdP7vM-lt\u0026q=85\u0026s=7923f2a85a0bfef60b4d1fc0539d6322`,alt:`Scenario Comparison page with LED Only and Simple Upgrade selected Consumption toggle Capital Planning Roadmap chart showing Baseline Target and scenario TTM lines from 2025 to 2040 and table comparing LED Only Simple Upgrade and Full retrofit savings capex incentives and payback`,\"data-og-width\":`1024`,width:`1024`,\"data-og-height\":`713`,height:`713`,\"data-path\":`images/energ/energ-capital-planning-scenario-comparison.png`,\"data-optimize\":`true`,\"data-opv\":`3`,srcset:`https://mintcdn.com/kodelabs/Ph3_DUgZdP7vM-lt/images/energ/energ-capital-planning-scenario-comparison.png?w=280\u0026fit=max\u0026auto=format\u0026n=Ph3_DUgZdP7vM-lt\u0026q=85\u0026s=f915c7140ffe408390fd273cb610f316 280w, https://mintcdn.com/kodelabs/Ph3_DUgZdP7vM-lt/images/energ/energ-capital-planning-scenario-comparison.png?w=560\u0026fit=max\u0026auto=format\u0026n=Ph3_DUgZdP7vM-lt\u0026q=85\u0026s=536d4ac96d802e14a0a6c3f91f07046a 560w, https://mintcdn.com/kodelabs/Ph3_DUgZdP7vM-lt/images/energ/energ-capital-planning-scenario-comparison.png?w=840\u0026fit=max\u0026auto=format\u0026n=Ph3_DUgZdP7vM-lt\u0026q=85\u0026s=790b610a144823a9fd097126cbba96bb 840w, https://mintcdn.com/kodelabs/Ph3_DUgZdP7vM-lt/images/energ/energ-capital-planning-scenario-comparison.png?w=1100\u0026fit=max\u0026auto=format\u0026n=Ph3_DUgZdP7vM-lt\u0026q=85\u0026s=fcca2f801d3914b71b8d76c4bc53cc35 1100w, https://mintcdn.com/kodelabs/Ph3_DUgZdP7vM-lt/images/energ/energ-capital-planning-scenario-comparison.png?w=1650\u0026fit=max\u0026auto=format\u0026n=Ph3_DUgZdP7vM-lt\u0026q=85\u0026s=d62503cc35aff68c27d54419ee8b0b98 1650w, https://mintcdn.com/kodelabs/Ph3_DUgZdP7vM-lt/images/energ/energ-capital-planning-scenario-comparison.png?w=2500\u0026fit=max\u0026auto=format\u0026n=Ph3_DUgZdP7vM-lt\u0026q=85\u0026s=5d35838ec2ded55db8682875dc078874 2500w`})}),`\n`,_jsx(Heading,{level:`3`,id:`page-controls-2`,children:`Page controls`}),`\n`,_jsxs(Table,{children:[_jsx(_components.thead,{children:_jsxs(_components.tr,{children:[_jsx(_components.th,{children:`Control`}),_jsx(_components.th,{children:`Purpose`})]})}),_jsxs(_components.tbody,{children:[_jsxs(_components.tr,{children:[_jsx(_components.td,{children:_jsx(_components.strong,{children:`Energy`})}),_jsx(_components.td,{children:`Scope or commodity filter for the roadmap`})]}),_jsxs(_components.tr,{children:[_jsx(_components.td,{children:_jsx(_components.strong,{children:`Scenario tags`})}),_jsxs(_components.td,{children:[`Select two or more scenarios, such as `,_jsx(_components.strong,{children:`LED Only`}),` and `,_jsx(_components.strong,{children:`Simple Upgrade`})]})]}),_jsxs(_components.tr,{children:[_jsx(_components.td,{children:_jsx(_components.strong,{children:`Target goal`})}),_jsxs(_components.td,{children:[`Long-range target overlay, such as `,_jsx(_components.strong,{children:`2040 Reduction Goal`})]})]}),_jsxs(_components.tr,{children:[_jsxs(_components.td,{children:[_jsx(_components.strong,{children:`Consumption`}),` / `,_jsx(_components.strong,{children:`Cost`}),` / `,_jsx(_components.strong,{children:`Emissions`})]}),_jsx(_components.td,{children:`Switch the roadmap and table between usage, spend, and CO₂e`})]})]})]}),`\n`,_jsx(Heading,{level:`3`,id:`capital-planning-roadmap`,children:`Capital Planning Roadmap`}),`\n`,_jsxs(_components.p,{children:[`The `,_jsx(_components.strong,{children:`Capital Planning Roadmap`}),` chart projects each selected scenario from the current year through `,_jsx(_components.strong,{children:`2040`}),`.`]}),`\n`,_jsxs(Table,{children:[_jsx(_components.thead,{children:_jsxs(_components.tr,{children:[_jsx(_components.th,{children:`Series`}),_jsx(_components.th,{children:`Meaning`})]})}),_jsxs(_components.tbody,{children:[_jsxs(_components.tr,{children:[_jsx(_components.td,{children:_jsx(_components.strong,{children:`Baseline`})}),_jsx(_components.td,{children:`Reference use without new measures`})]}),_jsxs(_components.tr,{children:[_jsx(_components.td,{children:_jsx(_components.strong,{children:`Target`})}),_jsx(_components.td,{children:`Published reduction path toward the goal year`})]}),_jsxs(_components.tr,{children:[_jsxs(_components.td,{children:[_jsx(_components.strong,{children:`LED Only TTM`}),` / `,_jsx(_components.strong,{children:`Simple Upgrade TTM`}),` / `,_jsx(_components.strong,{children:`Full retrofit TTM`})]}),_jsx(_components.td,{children:`Trailing-twelve-month forecast per scenario (line color matches the scenario)`})]})]})]}),`\n`,_jsxs(_components.p,{children:[`Steeper drops indicate larger or earlier savings. Compare scenario lines to `,_jsx(_components.strong,{children:`Target`}),` to see which bundle closes the gap soonest.`]}),`\n`,_jsx(Heading,{level:`3`,id:`comparison-table`,children:`Comparison table`}),`\n`,_jsx(_components.p,{children:`The table below the chart summarizes each scenario for the active toggle.`}),`\n`,_jsxs(Table,{children:[_jsx(_components.thead,{children:_jsxs(_components.tr,{children:[_jsx(_components.th,{children:`Column`}),_jsx(_components.th,{children:`What it shows`})]})}),_jsxs(_components.tbody,{children:[_jsxs(_components.tr,{children:[_jsx(_components.td,{children:_jsx(_components.strong,{children:`Scenario Name`})}),_jsx(_components.td,{children:`Bundle label`})]}),_jsxs(_components.tr,{children:[_jsx(_components.td,{children:_jsx(_components.strong,{children:`Total Annual Savings (Consumption)`})}),_jsx(_components.td,{children:`Annual energy reduction`})]}),_jsxs(_components.tr,{children:[_jsx(_components.td,{children:_jsx(_components.strong,{children:`Total Annual Savings (Cost)`})}),_jsx(_components.td,{children:`Annual cost reduction`})]}),_jsxs(_components.tr,{children:[_jsx(_components.td,{children:_jsx(_components.strong,{children:`Total Annual Savings (CO2e)`})}),_jsx(_components.td,{children:`Annual emissions reduction`})]}),_jsxs(_components.tr,{children:[_jsx(_components.td,{children:_jsx(_components.strong,{children:`Capex`})}),_jsx(_components.td,{children:`Total capital cost`})]}),_jsxs(_components.tr,{children:[_jsx(_components.td,{children:_jsx(_components.strong,{children:`Incentives`})}),_jsx(_components.td,{children:`Total rebates and grants`})]}),_jsxs(_components.tr,{children:[_jsx(_components.td,{children:_jsx(_components.strong,{children:`Projected Annual Consumption`})}),_jsx(_components.td,{children:`Percent reduction or projected use metric for the scenario`})]}),_jsxs(_components.tr,{children:[_jsx(_components.td,{children:_jsx(_components.strong,{children:`Simple Payback (Years)`})}),_jsx(_components.td,{children:`Payback period for the bundle`})]})]})]}),`\n`,_jsxs(_components.p,{children:[`Use the table to compare `,_jsx(_components.strong,{children:`Simple Payback`}),` and `,_jsx(_components.strong,{children:`Capex`}),` when you shortlist funding options. Open `,_jsx(_components.a,{href:`#scenario-analysis`,children:`Scenario Analysis`}),` for a single-scenario drill-down.`]}),`\n`,_jsx(Tip,{children:_jsx(_components.p,{children:`Compare at least one low-capex scenario and one deep-retrofit scenario so stakeholders see the tradeoff between payback speed and total savings.`})}),`\n`,_jsxs(_components.p,{children:[`For portfolio-wide comparison across buildings, use `,_jsx(_components.a,{href:`/products/energ/analytics/portfolio-capital-planning`,children:`Portfolio capital planning`}),`.`]}),`\n`,_jsx(Heading,{level:`2`,id:`next-steps`,children:`Next steps`}),`\n`,_jsxs(CardGroup,{cols:2,children:[_jsx(Card,{title:`Portfolio capital planning`,icon:`git-compare`,href:`/products/energ/analytics/portfolio-capital-planning`,arrow:true,cta:`Open`,children:_jsx(_components.p,{children:`Compare scenarios across buildings on the roadmap chart.`})}),_jsx(Card,{title:`Budget planning`,icon:`clipboard-list`,href:`/products/energ/finance/budget-planning`,arrow:true,cta:`Open`,children:_jsx(_components.p,{children:`Add capital projects from planning into an annual budget in step 4.`})}),_jsx(Card,{title:`Building information`,icon:`building-2`,href:`/products/energ/buildings/building-information`,arrow:true,cta:`Open`,children:_jsx(_components.p,{children:`Update area, heating, cooling, and service types before you lock a baseline.`})})]})]})}function MDXContent(props={}){const{wrapper:MDXLayout}={..._provideComponents(),...props.components};return MDXLayout?_jsx(MDXLayout,{...props,children:_jsx(_createMdxContent,{...props})}):_createMdxContent(props)}return{default:MDXContent};function _missingMdxReference(id,component){throw new Error(`Expected `+(component?`component`:`object`)+\" `\"+id+\"` to be defined: you likely forgot to import, pass, or provide it.\")}","frontmatter":{},"scope":{"codeStyling":{"theme":{"light":"github-light","dark":"github-dark"}},"config":{},"pageMetadata":{"title":"Capital planning","sidebarTitle":"Capital planning","description":"Set baseline periods, utility rates, and building context for decarbonization planning in EnerG","icon":"landmark","keywords":["EnerG","capital planning","basic information","baseline period","utility rates","decarbonization","KODE OS"],"href":"/products/energ/sustainability/capital-planning"}}},"mdxSourceWithNoJs":null},"mdxExtracts":{"tableOfContents":[{"title":"Capital Planning menu","slug":"capital-planning-menu","depth":2,"children":[]},{"title":"Open Basic Information","slug":"open-basic-information","depth":2,"children":[]},{"title":"Building and target settings","slug":"building-and-target-settings","depth":2,"children":[]},{"title":"Define baseline period","slug":"define-baseline-period","depth":2,"children":[]},{"title":"Visualize baseline usage","slug":"visualize-baseline-usage","depth":2,"children":[]},{"title":"Factors and calculations configuration","slug":"factors-and-calculations-configuration","depth":2,"children":[]},{"title":"Measure Creation","slug":"measure-creation","depth":2,"children":[{"title":"Add a new measure","slug":"add-a-new-measure","depth":3,"children":[]},{"title":"Create a custom curve","slug":"create-a-custom-curve","depth":3,"children":[]},{"title":"Measures table","slug":"measures-table","depth":3,"children":[]},{"title":"Distribution curves","slug":"distribution-curves","depth":3,"children":[]}]},{"title":"Scenario Planner","slug":"scenario-planner","depth":2,"children":[{"title":"Scenario cards","slug":"scenario-cards","depth":3,"children":[]},{"title":"Create a scenario","slug":"create-a-scenario","depth":3,"children":[]}]},{"title":"Scenario Analysis","slug":"scenario-analysis","depth":2,"children":[{"title":"Page controls","slug":"page-controls","depth":3,"children":[]},{"title":"Summary metrics","slug":"summary-metrics","depth":3,"children":[]},{"title":"Target chart","slug":"target-chart","depth":3,"children":[]},{"title":"Baseline vs. projected and measures timeline","slug":"baseline-vs-projected-and-measures-timeline","depth":3,"children":[]}]},{"title":"Scenario Comparison","slug":"scenario-comparison","depth":2,"children":[{"title":"Page controls","slug":"page-controls-2","depth":3,"children":[]},{"title":"Capital Planning Roadmap","slug":"capital-planning-roadmap","depth":3,"children":[]},{"title":"Comparison table","slug":"comparison-table","depth":3,"children":[]}]},{"title":"Next steps","slug":"next-steps","depth":2,"children":[]}],"codeExamples":{}},"jsLinks":["/_mintlify/custom/kodelabs/ce5d3bd08e955b7b/navbar-assistant.js"],"subdomain":"kodelabs","siteName":"KODE Labs - Product Documentation","title":"Capital planning - KODE Labs - Product Documentation","contextualStarterQuestions":[{"_id":"6a88bb881af966f81de13d65","deploymentId":"67fd4d9635f314f3a994be65","questionText":"What is a conservation measure?","status":"active","generatedBy":"contextual","path":"products/energ/sustainability/capital-planning","createdAt":"2026-08-21T20:56:40.055Z","updatedAt":"2026-08-21T20:56:40.055Z","__v":0},{"_id":"6a88bb881af966f81de13d66","deploymentId":"67fd4d9635f314f3a994be65","questionText":"How do I create scenarios?","status":"active","generatedBy":"contextual","path":"products/energ/sustainability/capital-planning","createdAt":"2026-08-21T20:56:40.055Z","updatedAt":"2026-08-21T20:56:40.055Z","__v":0},{"_id":"6a88bb881af966f81de13d64","deploymentId":"67fd4d9635f314f3a994be65","questionText":"How do I start capital planning?","status":"active","generatedBy":"contextual","path":"products/energ/sustainability/capital-planning","createdAt":"2026-08-21T20:56:40.054Z","updatedAt":"2026-08-21T20:56:40.054Z","__v":0}],"navMaps":{"firstHrefInVersion":{},"firstHrefInLanguage":{},"searchTabScopes":[]},"lastModified":"2026-08-19T11:09:39.574Z","gitLastModified":"2026-08-19T11:07:50.000Z","originalFileLocation":"products/energ/sustainability/capital-planning.mdx"},"headHtml":"\u003cscript data-mint-head>(function(){var d=document.documentElement,p=\"light\";if(!p){try{p=localStorage.getItem(\"isDarkMode\")}catch(e){}if(p==='true')p='dark';else if(p==='false')p='light';if(p!=='light'\u0026\u0026p!=='dark'\u0026\u0026p!=='system')p=\"light\"}var r=p==='system'?(matchMedia(\"(prefers-color-scheme: dark)\").matches?'dark':'light'):p;d.classList.remove(r==='dark'?'light':'dark');d.classList.add(r);d.setAttribute(\"data-theme-preference\",p)})();\u003c/script>\u003cmeta data-mint-head name=\"description\" content=\"Set baseline periods, utility rates, and building context for decarbonization planning in EnerG\">\u003cmeta data-mint-head name=\"application-name\" content=\"KODE Labs - Product Documentation\">\u003cmeta data-mint-head name=\"generator\" content=\"Mintlify\">\u003clink data-mint-head rel=\"icon\" type=\"image/png\" sizes=\"192x192\" href=\"/mintlify-assets/_mintlify/favicons/kodelabs/vtcGE1gj2AkAE1l2/_generated/favicon/android-chrome-192x192.png\" media=\"(prefers-color-scheme: light)\">\u003clink data-mint-head rel=\"apple-touch-icon\" type=\"image/png\" sizes=\"180x180\" href=\"/mintlify-assets/_mintlify/favicons/kodelabs/vtcGE1gj2AkAE1l2/_generated/favicon/apple-touch-icon.png\">\u003clink data-mint-head rel=\"icon\" type=\"image/png\" sizes=\"16x16\" href=\"/mintlify-assets/_mintlify/favicons/kodelabs/vtcGE1gj2AkAE1l2/_generated/favicon/favicon-16x16.png\" media=\"(prefers-color-scheme: light)\">\u003clink data-mint-head rel=\"icon\" type=\"image/png\" sizes=\"32x32\" href=\"/mintlify-assets/_mintlify/favicons/kodelabs/vtcGE1gj2AkAE1l2/_generated/favicon/favicon-32x32.png\" media=\"(prefers-color-scheme: light)\">\u003clink data-mint-head rel=\"shortcut icon\" type=\"image/x-icon\" href=\"/mintlify-assets/_mintlify/favicons/kodelabs/vtcGE1gj2AkAE1l2/_generated/favicon/favicon.ico\" media=\"(prefers-color-scheme: light)\">\u003clink data-mint-head rel=\"icon\" type=\"image/png\" sizes=\"192x192\" href=\"/mintlify-assets/_mintlify/favicons/kodelabs/vtcGE1gj2AkAE1l2/_generated/favicon-dark/android-chrome-192x192.png\" media=\"(prefers-color-scheme: dark)\">\u003clink data-mint-head rel=\"icon\" type=\"image/png\" sizes=\"16x16\" href=\"/mintlify-assets/_mintlify/favicons/kodelabs/vtcGE1gj2AkAE1l2/_generated/favicon-dark/favicon-16x16.png\" media=\"(prefers-color-scheme: dark)\">\u003clink data-mint-head rel=\"icon\" type=\"image/png\" sizes=\"32x32\" href=\"/mintlify-assets/_mintlify/favicons/kodelabs/vtcGE1gj2AkAE1l2/_generated/favicon-dark/favicon-32x32.png\" media=\"(prefers-color-scheme: dark)\">\u003clink data-mint-head rel=\"shortcut icon\" type=\"image/x-icon\" href=\"/mintlify-assets/_mintlify/favicons/kodelabs/vtcGE1gj2AkAE1l2/_generated/favicon-dark/favicon.ico\" media=\"(prefers-color-scheme: dark)\">\u003cmeta data-mint-head property=\"og:title\" content=\"Capital planning - KODE Labs - Product Documentation\">\u003cmeta data-mint-head property=\"og:description\" content=\"Set baseline periods, utility rates, and building context for decarbonization planning in EnerG\">\u003cmeta data-mint-head property=\"og:site_name\" content=\"KODE Labs - Product Documentation\">\u003cmeta data-mint-head property=\"og:url\" content=\"https://docs.kodelabs.com/products/energ/sustainability/capital-planning\">\u003cmeta data-mint-head property=\"og:type\" content=\"website\">\u003cmeta data-mint-head property=\"og:image\" content=\"https://kodelabs.mintlify.site/_mintlify/api/og/v2?division=Building+view\u0026amp;title=Capital+planning\u0026amp;description=Set+baseline+periods%2C+utility+rates%2C+and+building+context+for+decarbonization+planning+in+EnerG\u0026amp;theme=ac252318c016362b89abdbd3\u0026amp;signature=736c63c7ad5dccd5a26b0c013735169447a2b80b2138b7f61e26c602725e300c\">\u003cmeta data-mint-head property=\"og:image:width\" content=\"1200\">\u003cmeta data-mint-head property=\"og:image:height\" content=\"630\">\u003cmeta data-mint-head name=\"twitter:card\" content=\"summary_large_image\">\u003cmeta data-mint-head name=\"twitter:title\" content=\"Capital planning - KODE Labs - Product Documentation\">\u003cmeta data-mint-head name=\"twitter:description\" content=\"Set baseline periods, utility rates, and building context for decarbonization planning in EnerG\">\u003cmeta data-mint-head name=\"twitter:image\" content=\"https://kodelabs.mintlify.site/_mintlify/api/og/v2?division=Building+view\u0026amp;title=Capital+planning\u0026amp;description=Set+baseline+periods%2C+utility+rates%2C+and+building+context+for+decarbonization+planning+in+EnerG\u0026amp;theme=ac252318c016362b89abdbd3\u0026amp;signature=736c63c7ad5dccd5a26b0c013735169447a2b80b2138b7f61e26c602725e300c\">\u003cmeta data-mint-head name=\"twitter:image:width\" content=\"1200\">\u003cmeta data-mint-head name=\"twitter:image:height\" content=\"630\">\u003cmeta data-mint-head name=\"msapplication-config\" content=\"/mintlify-assets/_mintlify/favicons/kodelabs/vtcGE1gj2AkAE1l2/_generated/favicon/browserconfig.xml\">\u003cmeta data-mint-head name=\"apple-mobile-web-app-title\" content=\"KODE Labs - Product Documentation\">\u003cmeta data-mint-head name=\"msapplication-TileColor\" content=\"#015BFA\">\u003clink data-mint-head rel=\"canonical\" href=\"https://docs.kodelabs.com/products/energ/sustainability/capital-planning\">\u003clink data-mint-head rel=\"alternate\" type=\"application/xml\" href=\"/sitemap.xml\">\u003clink data-mint-head rel=\"alternate\" type=\"text/markdown\" href=\"/products/energ/sustainability/capital-planning.md\">\u003cscript data-mint-head type=\"application/ld+json\">{\"@context\":\"https://schema.org\",\"@graph\":[{\"@type\":\"Organization\",\"@id\":\"https://docs.kodelabs.com/#organization\",\"name\":\"KODE Labs - Product Documentation\",\"url\":\"https://docs.kodelabs.com\",\"logo\":{\"@type\":\"ImageObject\",\"url\":\"https://mintcdn.com/kodelabs/YfYud6Al4TM68wc2/logo/logo-light.png?fit=max\u0026auto=format\u0026n=YfYud6Al4TM68wc2\u0026q=85\u0026s=00d4ffd6ad7a592e52856804d1a53d12\"}},{\"@type\":\"WebSite\",\"@id\":\"https://docs.kodelabs.com#website\",\"name\":\"KODE Labs - Product Documentation\",\"url\":\"https://docs.kodelabs.com\",\"publisher\":{\"@id\":\"https://docs.kodelabs.com/#organization\"}},{\"@type\":\"WebPage\",\"@id\":\"https://docs.kodelabs.com/products/energ/sustainability/capital-planning#webpage\",\"url\":\"https://docs.kodelabs.com/products/energ/sustainability/capital-planning\",\"name\":\"Capital planning\",\"description\":\"Set baseline periods, utility rates, and building context for decarbonization planning in EnerG\",\"dateModified\":\"2026-08-19T11:07:50.000Z\",\"isPartOf\":{\"@id\":\"https://docs.kodelabs.com#website\"},\"breadcrumb\":{\"@id\":\"https://docs.kodelabs.com/products/energ/sustainability/capital-planning#breadcrumb\"}},{\"@type\":\"BreadcrumbList\",\"@id\":\"https://docs.kodelabs.com/products/energ/sustainability/capital-planning#breadcrumb\",\"itemListElement\":[{\"@type\":\"ListItem\",\"position\":1,\"name\":\"Building view\",\"item\":\"https://docs.kodelabs.com/products/energ/analytics/site-dashboards\"},{\"@type\":\"ListItem\",\"position\":2,\"name\":\"Capital planning\",\"item\":\"https://docs.kodelabs.com/products/energ/sustainability/capital-planning\"}]},{\"@type\":[\"Article\",\"TechArticle\"],\"@id\":\"https://docs.kodelabs.com/products/energ/sustainability/capital-planning#article\",\"headline\":\"Capital planning\",\"name\":\"Capital planning\",\"description\":\"Set baseline periods, utility rates, and building context for decarbonization planning in EnerG\",\"url\":\"https://docs.kodelabs.com/products/energ/sustainability/capital-planning\",\"mainEntityOfPage\":{\"@id\":\"https://docs.kodelabs.com/products/energ/sustainability/capital-planning#webpage\"},\"dateModified\":\"2026-08-19T11:07:50.000Z\",\"keywords\":\"EnerG, capital planning, basic information, baseline period, utility rates, decarbonization, KODE OS\",\"publisher\":{\"@id\":\"https://docs.kodelabs.com/#organization\"},\"isPartOf\":{\"@id\":\"https://docs.kodelabs.com#website\"}}]}\u003c/script>","agentPointerHref":"/products/energ/sustainability/capital-planning.md","siteName":"KODE Labs - Product Documentation","nav":{"global":{"anchors":[{"anchor":"Home","icon":"house","href":"/"},{"anchor":"What's New","icon":"megaphone","href":"/whats-new/2026/v3.20-november-2026"}]},"products":[{"product":"Cloud BMS","icon":"https://mintlify.s3.us-west-1.amazonaws.com/kodelabs/images/cloud-bms.svg","description":"Cloud building management, graphics, and control","pages":[{"title":"Cloud BMS","href":"/products/kode-os/get-started/introduction"}]},{"product":"Building BI","icon":"https://mintlify.s3.us-west-1.amazonaws.com/kodelabs/images/bbi.svg","description":"Dashboards and analytics for building performance","pages":[{"title":"Building BI","href":"/products/building-bi/overview"}]},{"product":"FDD","icon":"https://mintlify.s3.us-west-1.amazonaws.com/kodelabs/images/fdd.svg","description":"Fault detection and diagnostics for equipment","pages":[{"title":"FDD","href":"/products/fdd/overview"}]},{"product":"FTT","icon":"https://mintlify.s3.us-west-1.amazonaws.com/kodelabs/images/ftt.svg","description":"Automated functional testing and commissioning","pages":[{"title":"FTT","href":"/products/ftt/overview"}]},{"product":"AssetOps","icon":"https://mintlify.s3.us-west-1.amazonaws.com/kodelabs/images/assetops.svg","description":"Asset and maintenance operations","pages":[{"title":"AssetOps","href":"/products/assetops/quickstart/overview"}]},{"product":"EnerG","icon":"https://mintlify.s3.us-west-1.amazonaws.com/kodelabs/images/enerG.svg","description":"Energy management and sustainability reporting","groups":[{"group":"Get Started","pages":[{"title":"What is EnerG?","sidebarTitle":"Introduction","icon":"rocket","href":"/products/energ/get-started/introduction"},{"title":"Key concepts","sidebarTitle":"Key concepts","icon":"lightbulb","href":"/products/energ/get-started/key-concepts"},{"title":"Portfolio and building navigation","sidebarTitle":"Navigation","icon":"map","href":"/products/energ/get-started/navigation"}]},{"group":"Concepts","icon":"lightbulb","pages":[{"title":"Data sources and meters","sidebarTitle":"Data and meters","icon":"gauge","href":"/products/energ/concepts/data-and-meters"},{"title":"Data completeness","sidebarTitle":"Data completeness","icon":"percent","href":"/products/energ/concepts/data-completeness"},{"title":"Interval data normalization","sidebarTitle":"Interval normalization","icon":"filter","href":"/products/energ/concepts/interval-data-normalization"},{"title":"Benchmarking and intensity metrics","sidebarTitle":"Benchmarking","icon":"chart-column","href":"/products/energ/concepts/benchmarking-and-intensity"},{"title":"Baselines and weather normalization","sidebarTitle":"Baselines and weather","icon":"chart-line","href":"/products/energ/concepts/baselines-and-weather-normalization"},{"title":"Energy modeling and M\u0026V","sidebarTitle":"Energy modeling","icon":"activity","href":"/products/energ/concepts/energy-modeling"},{"title":"Budgets and capital planning","sidebarTitle":"Budgets and capital","icon":"dollar-sign","href":"/products/energ/concepts/budgets-and-capital-planning"},{"title":"Emissions accounting","sidebarTitle":"Emissions accounting","icon":"cloud","href":"/products/energ/concepts/emissions-accounting"}]},{"group":"Portfolio view","pages":[{"title":"Portfolio Home","sidebarTitle":"Home","icon":"house","href":"/products/energ/analytics/benchmarking"},{"group":"Dashboards","icon":"layout-dashboard","expanded":false,"pages":[{"title":"Portfolio Energy dashboard","sidebarTitle":"Energy","icon":"zap","href":"/products/energ/analytics/portfolio-dashboards-energy"},{"title":"Portfolio Water dashboard","sidebarTitle":"Water","icon":"droplets","href":"/products/energ/analytics/portfolio-dashboards-water"},{"title":"Portfolio Waste dashboard","sidebarTitle":"Waste","icon":"trash-2","href":"/products/energ/analytics/portfolio-dashboards-waste"}]},{"group":"Data Sources","icon":"database","expanded":false,"pages":[{"title":"Portfolio data sources","sidebarTitle":"Overview","icon":"database","href":"/products/energ/analytics/portfolio-data-sources"},{"title":"Arcadia","sidebarTitle":"Arcadia","icon":"plug","href":"/products/energ/data-sources/arcadia"},{"title":"ENERGY STAR Portfolio Manager","sidebarTitle":"ENERGY STAR","icon":"refresh-cw","href":"/products/energ/data-sources/portfolio-manager"},{"title":"CSV uploads","sidebarTitle":"CSV uploads","icon":"file-spreadsheet","href":"/products/energ/data-sources/csv-uploads"},{"title":"Manual entry","sidebarTitle":"Manual entry","icon":"pencil","href":"/products/energ/data-sources/manual-entry"},{"title":"KODE OS data source","sidebarTitle":"KODE OS","icon":"plug","href":"/products/energ/data-sources/kode-os-data-source"}]},{"title":"Portfolio meters","sidebarTitle":"Meters","icon":"gauge","href":"/products/energ/analytics/portfolio-meters"},{"group":"Baseline analysis","icon":"chart-line","expanded":false,"pages":[{"title":"Baseline analysis overview","sidebarTitle":"Overview","icon":"layout-grid","href":"/products/energ/analytics/baseline-portfolio-overview"},{"title":"Baseline analysis configurations","sidebarTitle":"Configurations","icon":"settings-2","href":"/products/energ/analytics/baseline-portfolio-configurations"}]},{"title":"Portfolio targets","sidebarTitle":"Target","icon":"target","href":"/products/energ/analytics/portfolio-targets"},{"title":"Portfolio budget and planning","sidebarTitle":"Budget","icon":"dollar-sign","href":"/products/energ/analytics/portfolio-budgets"},{"title":"Portfolio capital planning","sidebarTitle":"Capital planning","icon":"layers","href":"/products/energ/analytics/portfolio-capital-planning"},{"group":"Emissions","icon":"cloud","expanded":false,"pages":[{"title":"Portfolio emissions overview","sidebarTitle":"Overview","icon":"cloud","href":"/products/energ/analytics/portfolio-emissions-overview"},{"title":"Portfolio emissions benchmarking","sidebarTitle":"Benchmarking","icon":"chart-column","href":"/products/energ/analytics/portfolio-emissions-benchmarking"},{"title":"Emission factors library","sidebarTitle":"Emission factors","icon":"book-open","href":"/products/energ/analytics/portfolio-emissions-emission-factors"},{"title":"Volume contracts","sidebarTitle":"Contracts","icon":"file-text","href":"/products/energ/analytics/portfolio-emissions-contracts"},{"title":"Fleet emissions","sidebarTitle":"Fleet emissions","icon":"truck","href":"/products/energ/analytics/portfolio-emissions-fleet-emissions"},{"title":"Fugitive emissions","sidebarTitle":"Fugitive emissions","icon":"wind","href":"/products/energ/analytics/portfolio-emissions-fugitive-emissions"}]},{"title":"Portfolio certifications","sidebarTitle":"Certifications","icon":"award","href":"/products/energ/analytics/portfolio-certifications"},{"title":"Alert center","sidebarTitle":"Alert center","icon":"cog","href":"/products/energ/data-quality/alert-center"},{"title":"Report Builder","sidebarTitle":"Report Builder","icon":"file-spreadsheet","href":"/products/energ/finance/reporting"}]},{"group":"Building view","pages":[{"group":"Dashboards","icon":"layout-dashboard","expanded":false,"pages":[{"title":"Building dashboards overview","sidebarTitle":"Dashboards Overview","icon":"layout-dashboard","href":"/products/energ/analytics/site-dashboards"},{"title":"Building Energy dashboard","sidebarTitle":"Energy","icon":"zap","href":"/products/energ/analytics/building-dashboards-energy"},{"title":"Building Water dashboard","sidebarTitle":"Water","icon":"droplets","href":"/products/energ/analytics/building-dashboards-water"},{"title":"Building Waste dashboard","sidebarTitle":"Waste","icon":"trash-2","href":"/products/energ/analytics/building-dashboards-waste"}]},{"title":"Building information","sidebarTitle":"Building information","icon":"cog","href":"/products/energ/buildings/building-information"},{"title":"Building meters","sidebarTitle":"Meters","icon":"gauge","href":"/products/energ/buildings/meters"},{"group":"Energy Modeling","icon":"activity","expanded":false,"pages":[{"title":"Create an M\u0026V model","sidebarTitle":"M\u0026V","icon":"circle-fading-plus","href":"/products/energ/energy-modeling/mv-models"},{"title":"M\u0026V analysis","sidebarTitle":"M\u0026V analysis","icon":"cog","href":"/products/energ/energy-modeling/mv-analysis"},{"title":"Forecasting","sidebarTitle":"Forecast","icon":"chart-line","href":"/products/energ/energy-modeling/forecasting"}]},{"group":"Data Sources","icon":"database","expanded":false,"pages":[{"title":"Building data sources","sidebarTitle":"Overview","icon":"database","href":"/products/energ/buildings/data-sources"},{"title":"Arcadia","sidebarTitle":"Arcadia","icon":"plug","href":"/products/energ/data-sources/arcadia"},{"title":"CSV uploads","sidebarTitle":"CSV uploads","icon":"file-spreadsheet","href":"/products/energ/data-sources/csv-uploads"},{"title":"Manual entry","sidebarTitle":"Manual entry","icon":"pencil","href":"/products/energ/data-sources/manual-entry"},{"title":"KODE OS data source","sidebarTitle":"KODE OS","icon":"plug","href":"/products/energ/data-sources/kode-os-data-source"}]},{"group":"Budget","icon":"dollar-sign","expanded":false,"pages":[{"title":"Building budget overview","sidebarTitle":"Overview","icon":"dollar-sign","href":"/products/energ/finance/budget-overview"},{"title":"Budget model configuration","sidebarTitle":"Model configuration","icon":"settings-2","href":"/products/energ/finance/budgets"},{"title":"Budget planning","sidebarTitle":"Planning","icon":"clipboard-list","href":"/products/energ/finance/budget-planning"},{"title":"Utility cost analysis","sidebarTitle":"Cost analysis","description":"Review utility costs, download statements, and analyze spending for one building in EnerG","icon":"cog","href":"/products/energ/finance/cost-analysis"}]},{"title":"Capital planning","sidebarTitle":"Capital planning","icon":"landmark","href":"/products/energ/sustainability/capital-planning"},{"title":"Building emissions overview","sidebarTitle":"Emissions","description":"Monitor GHG emissions, offsets, and renewable contracts for one building in EnerG","icon":"cloud","href":"/products/energ/buildings/emissions-overview"},{"title":"Building certifications","sidebarTitle":"Certifications","icon":"award","href":"/products/energ/sustainability/certifications"},{"group":"Data Quality","icon":"shield-check","expanded":false,"pages":[{"title":"Data quality","sidebarTitle":"Overview","icon":"book-open","href":"/products/energ/data-quality/data-quality-overview"},{"title":"Data completeness","sidebarTitle":"Data completeness","icon":"percent","href":"/products/energ/data-quality/data-completeness"},{"title":"Meter comparisons","sidebarTitle":"Meter comparisons","icon":"git-compare","href":"/products/energ/data-quality/meter-comparisons"}]}]},{"group":"Reference","icon":"book-a","pages":[{"title":"Data and meter fields","sidebarTitle":"Data and meter fields","icon":"table","href":"/products/energ/reference/data-and-meter-fields"},{"title":"Calculations and parameters","sidebarTitle":"Calculations","icon":"calculator","href":"/products/energ/reference/calculations-and-parameters"},{"title":"Emissions reference","sidebarTitle":"Emissions reference","icon":"table","href":"/products/energ/reference/emissions-reference"},{"title":"Interval normalization labels","sidebarTitle":"Normalization labels","icon":"table","href":"/products/energ/reference/interval-normalization-labels"},{"title":"Reporting and alerts reference","sidebarTitle":"Reporting and alerts","icon":"table","href":"/products/energ/reference/reporting-and-alerts"},{"title":"KODE glossary","sidebarTitle":"Glossary","icon":"book-a","href":"/products/energ/glossary"}]}]},{"product":"Launchpad","icon":"https://mintlify.s3.us-west-1.amazonaws.com/kodelabs/images/launchpad.svg","description":"Dynamic management for apps, users, and buildings","pages":[{"title":"Launchpad","href":"/products/launchpad/get-started/introduction"}]},{"product":"Mobile app","icon":"https://mintlify.s3.us-west-1.amazonaws.com/kodelabs/images/mobile-app.svg","description":"Monitor and operate buildings from iOS and Android","pages":[{"title":"Mobile app","href":"/products/mobile-app/overview"}]},{"product":"KODE API","icon":"braces","description":"Build services and integrations with KODE OS","pages":[{"title":"KODE API","href":"/products/kode-api"}]},{"product":"Integrations","icon":"cable","description":"Connect 200+ building systems to KODE OS","pages":[{"title":"Integrations","href":"/products/integrations/get-started/introduction"}]},{"product":"What's New","icon":"megaphone","description":"KODE platform release notes and updates","pages":[{"title":"What's New","href":"/whats-new/2026/v3.20-november-2026"}]}]},"basePath":"","title":"Capital planning - KODE Labs - Product Documentation","deploymentId":"dpl_7AgmPo2RyRWZ68ZGceW618SWGEAz","buildId":"dpl_7AgmPo2RyRWZ68ZGceW618SWGEAz","dynamics":["10e4515597","07c022d89b","a74be98ba7"],"chunks":["BannerMarkdown-Cc6DT3k_.js","dist-BbIWfytJ.js","lib-DMeTj1gb.js","lib-B8HbPgcC.js","katex-Dbtb6Wk7.js","html-void-elements-mCSPHezU.js","marked.esm-CZWythHk.js","Frame-CvAlztAG.js","DynamicMarkdown-T8UDalrO.js","zoom-image-lightbox-HqsaJYmF.js","lightbox-handle-r17bVUz3.js"]}