Review building-level waste quantities, costs, diversion rate, and composition charts in EnerG
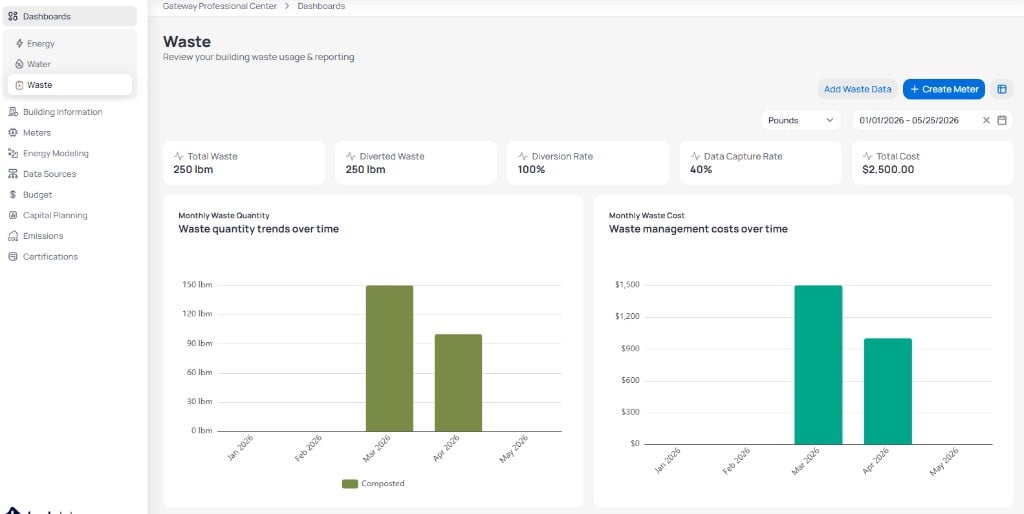
The building Waste dashboard shows how one site performs on waste quantity, cost, and diversion. In the building view, open Dashboards in the left sidebar, then select Waste. The page header reads Waste with the subtitle Review your building waste usage & reporting.Unlike Energy and Water, the Waste dashboard uses a single view without a secondary report menu.
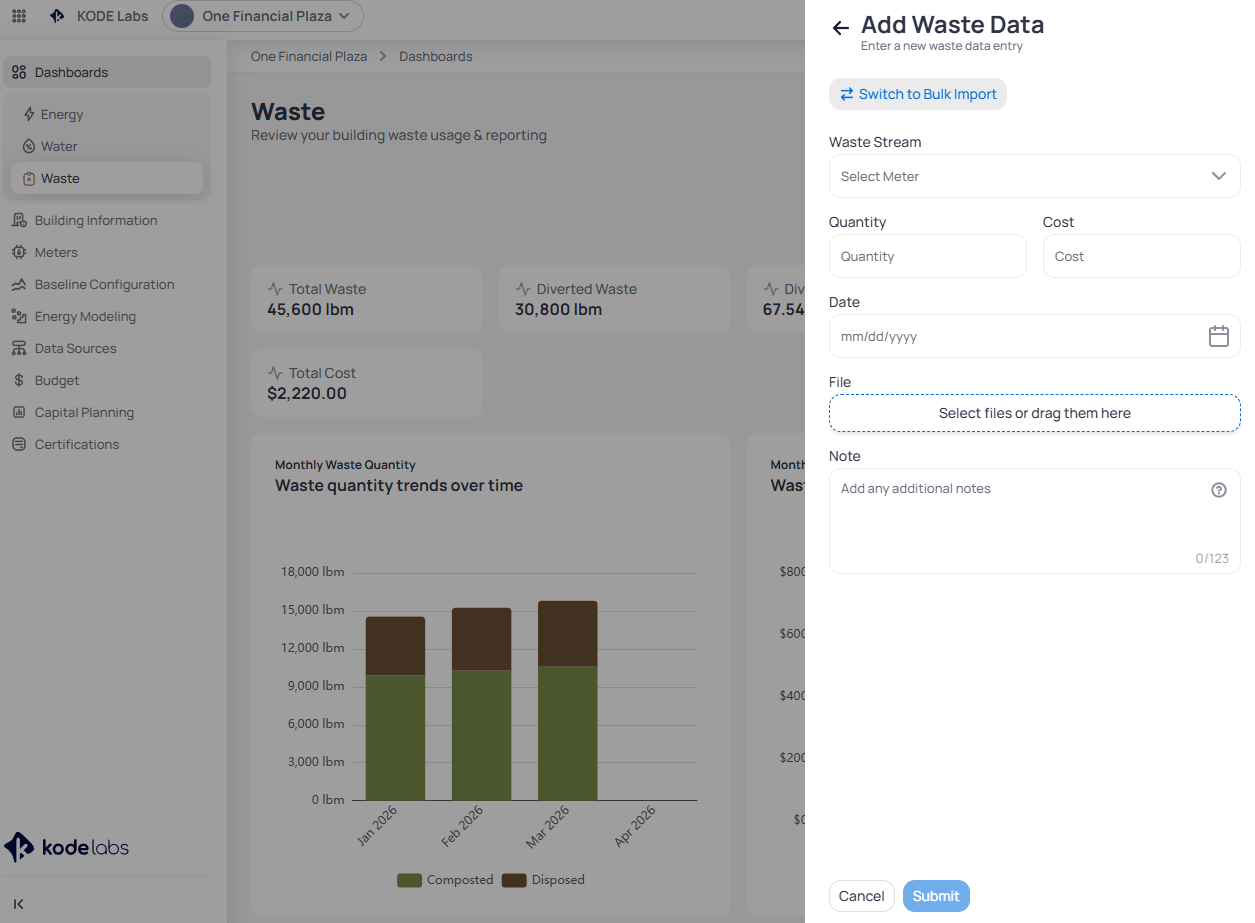
Building Waste dashboard with KPI cards and monthly quantity and cost charts
Building Waste reports apply to the site you selected in the top bar. Portfolio rollups live on the Portfolio Waste dashboard.
Open the form to record a pickup against an existing waste stream
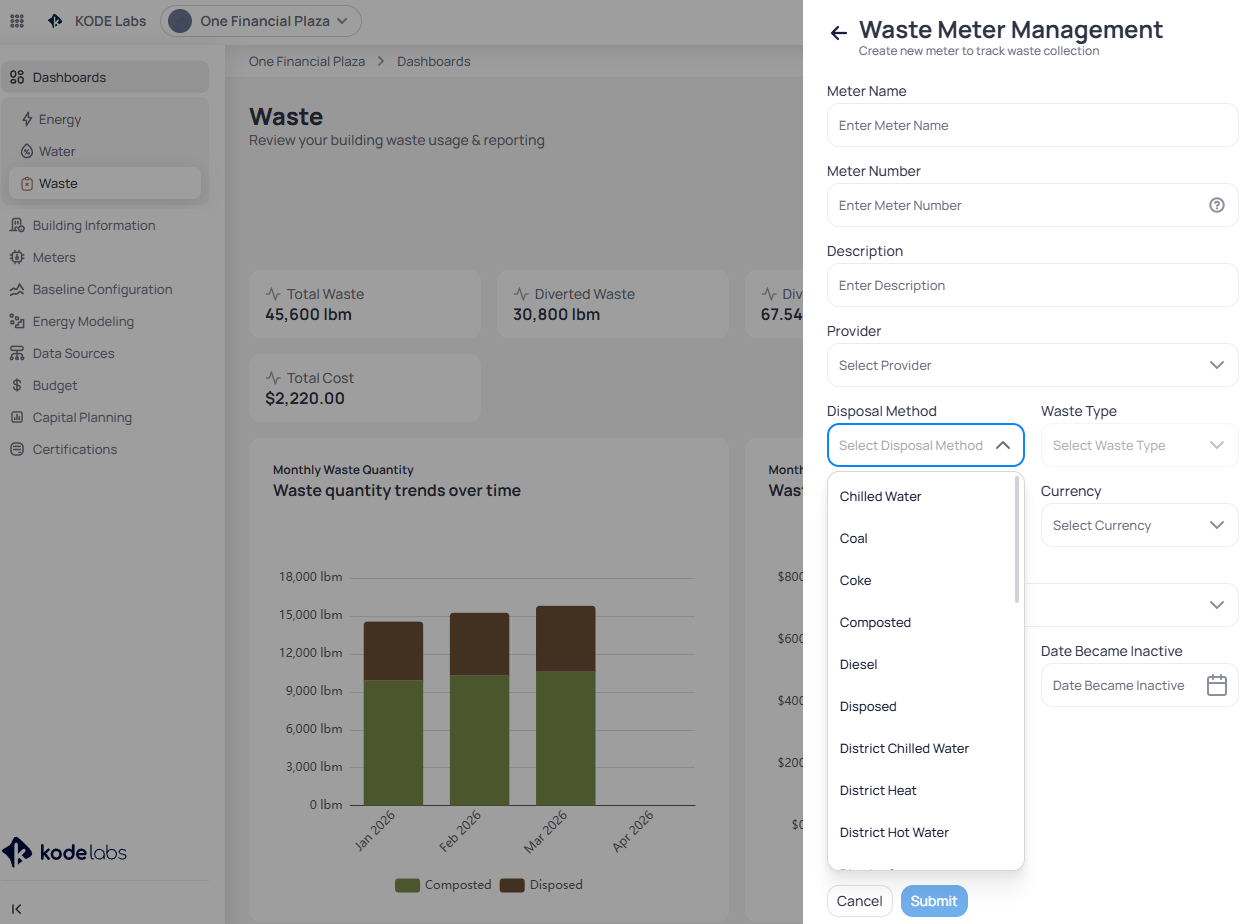
Create Meter
Define a new waste stream with disposal method, waste type, unit, and currency
Unit
Display quantities in Pounds, kilograms, or other supported units
Date range
Set the period for KPIs and charts (for example, 01/01/2026 – 05/25/2026)
Waste data is usually entered manually because automated hauler feeds are uncommon. Use Create Meter to define streams, then Add Waste Data for each pickup.
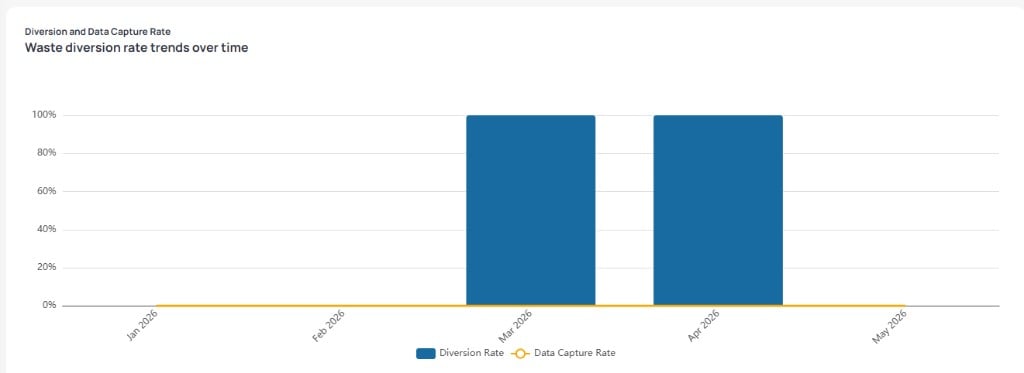
Diversion Rate bars show the share of waste diverted each month. Data Capture Rate (yellow line) shows reporting completeness over the same period. A high diversion rate with a low capture rate can mean incomplete stream coverage rather than strong diversion performance.
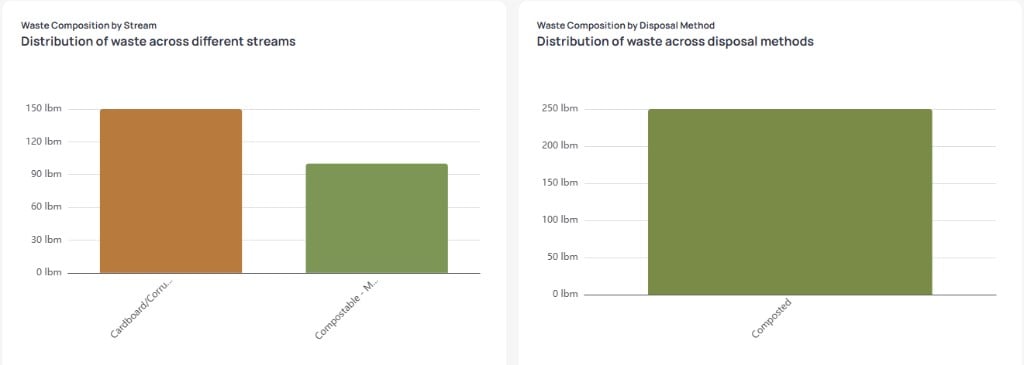
The Waste Composition by Disposal Method chart totals quantity by outcome, such as Composted. Compare it to the stream chart to confirm disposal methods align with material types.